
HP StorageWorks Reference Information Storage System V1.1 Administrator Guide (February 2005)

LO
Chapter 2:
Platform Control Center
Monitoring folder
2-50 HP StorageWorks Reference Information Storage System Administrator Guide, February 2005
Monitoring folder
Tactical Monitoring view
This view provides a high-level summary of system status (health) and
monitoring services. Use this view to enable or disable individual monitoring
features.
This view shows how many hosts and services have each status value and
how many problems are acknowledged and unacknowledged (
unhandled
). Use
other views to investigate these problems further.
Related Views
•
The charts
Hosts
and
Services
in the
Tactical Monitoring
repeat information
available in the charts
Host Status Totals
and
Service Status Totals
in other
views. See
Status Summary view
, on page 2-17.
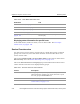
Table 2-28: Tactical Monitoring view features
Feature Description
Monitoring
Performance
Current performance of monitoring processes:
• Check Execution Time: Minimum, maximum, and average times
to execute a monitoring check
• Check Latency: Minimum, maximum, and average durations
between time a monitoring check was scheduled and time it
was executed
• # Active Checks: How many services are monitored
• # Passive Checks: Currently
not used
(all checks are active)
Network Health Average health of all hosts and services. Green indicates normal
operation; red indicates one or more components stopped or
failed; yellow indicates potential problems (warning). See
Host
and service status values
, on page 2-14
, for more information.
Hosts Number of hosts with each host status value.
Services Number of services with each service status value.
Monitoring Features Indicates if Notifications and Active Checks are enabled. (RISS
does
not use
Flap Detection; or Event Handlers and Passive Checks, which
are enabled by default.)