
HP StorageWorks Reference Information Storage System V1.1 Administrator Guide (February 2005)

Alerts folder Chapter 2:
Platform Control Center
HP StorageWorks Reference Information Storage System Administrator Guide, February 2005 2-97
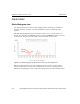
Creating alert histogram reports
1. Choose report type:
Host
or
Service
.
2. Choose host or service.
3. Choose report options:
– Report Period
: Choose predefined period (
Last 24 Hours
,
Today
,
Yesterday
,
This Week
,
Last 7 Days
,
Last Week
,
This Month
,
Last Month
,
This Year
,
Last
Year
); or choose
* CUSTOM REPORT PERIOD *
, and specify custom
report start and end dates.
– Statistics Breakdown
: Choose time scale to use for
Report Period
:
Month
,
Day of the Month
,
Day of the Week
, or
Hour of the Day
.
– Events To Graph
: Choose type of host or service events to report on:
events indicating change to specific status value, all problem status
values, or all events.
– State Types To Graph
: Choose status conditions to graph:
HARD
,
SOFT
,
or both. See
Hard and soft status conditions
, on page 2-15.
– Assume State Retention
: Typically, you use the default,
Yes
. Choose
Yes
to use last recorded status value before PCC startup as status value
assumed for periods when monitoring was down.
– Initial States Logged
:
Not used
– Ignore Repeated States
:
Not used
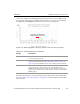
4. Click
Create Report
.
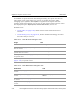
Alerts History view
This view provides a chronology of logged PCC alerts. Alerts are a subset of
events listed in the
Event Log
view. You can filter this view to display only
specific alert types, and display alerts for any given day.
Service Detail view
, on page 2-53
, for host View Status Detail For This Host
Table 2-75: Links
from
Alerts Histogram view (continued)
Destination Link