
HP StorageWorks Reference Information Storage System V1.5 Administrator Guide (T3559-96044, June 2006)
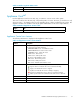
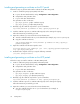

Creating performance graphs
1. Click the System Monitoring tab or the Appliance Store and Indexing tab for the category of graph
that you wan
ttocreate.
2. Select a graph type:
• For System Monitoring, select Idle CPU Usage, Free Memory,orActive Thread Count.
•ForApplian
ce Store and Indexing, select Store Rate, Index Rate, Doc Count,orIndex Count.
3. Select one
of the following options:
• Machine Type (System Monitoring graphs): Select the type of machine (for example, PCC
Servers or Smart Cell Servers).
•Assigned
Smartcell/Domain (Appliance Store and Indexing graphs): Select All Appliance,
Domain name,orSmar t Cell IP address.
4. Select the time frame and reporting interval:
•TimeFra
me: For a preselected time period, click Select Time Frame,andselectatimeframe
from the drop-down list.
• From Date, To Date: For a custom time period, click Custom Time Range,andselect
the start date and time and end date and time. The custom time range can be useful for
troubl
eshooting.
• Interval: Select the reporting interval from the drop-down list.
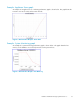
5. Click Generate Graph.
34
System Status