
HP StorageWorks Reference Information Storage System V1.4 Administrator Guide (T3559-96027, March 2006)
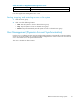
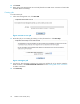

Displaying serv
ices with a specific status
In the System Status p age, under Service Status To tals, click the status column he ading, such as Critical.
The Service Detail view appears. See "Service Detail" on page 57 for more information.
Displaying specifichostgroups
In the System Status page, under Status Summary for HostGroup, click the Host Group name, such
as Smar t C ells. The Service Overview view appears. See "Service Overview" on page 61 for more
information.
In the System Status page, under Status Summary for All Host Groups, click the host group name's
parenthetical abb reviation, such as (sc). The Hostgroup Information view appears. See "Hostgroup
Information"onpage98formoreinformation.
Displaying specific host groups and host statuses
In the System Status page, under Status Summar y for All Host Groups, click the Host Status Totals column
entry for a host group an d status value, such as 2DOWN. The Service Status Details view appears. See
"Service Detail" on page 57 for mor e inf ormation.
Displaying specifichostgroupsandservicestatuses
In the System Status page, under Status Summary for All Host Groups, click the Service Status Totals
column entr y for a host group and status value, such as 1CRITICAL. The Ser vice Status Details view
appears. See "Ser vice Detail" on page 57 for more information.
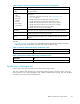
Storage
Status
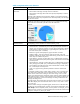
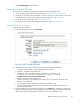
This vie
w provides graphical and detailed storage information on each domain in the system. It provides
usage in
formation on the number of documents and amount of used and available storage.
Table 12
Storage Status view features
Feature
Description
Applia
nce Store
The domains, number of documents stored per domain, the store rate, and
allocated spac e for storage and replication. Click on the pa g e icon beside the
domain
to vie w the domain configuration page.
Smart cell allocation shows the number of smart cells in each life cycle state. Lost
is a pseudostate indicating smart cells whose current life cycle state cannot be
determined.
Store Rate Graph
Graphshowingnumberofmessagespersecondeachdomainonthesystem
stored in given specified time frame. The default shows storage rate in last
hour, ending with current time. Click Last 24 Hours, Last Month,orLast Year
to change time period.
Domain Details
Domain group id, number of documents stored, amount of used and total space,
and di sk space ratio.
Related Views
•
"Displaying the Smar t Cell Groups for Domain view" on page 34, provides Store/Index/Indexer
Latency graphs for individual smart cell groups.
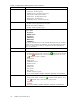
System Status
This view provides graphical performance and resource information.
32
Platform Control Center (PCC)