
HP XPWatch and HP XPSketch Reference Guide


A HP XPWatch use case scenarios
Scenario 1: Port I/O spike
Business case
Periodic port I/O spikes are observed in XP7 Performance Advisor.
Objective
Locate the offending host group/application.
Resolution
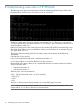
HP XPWatch can be used to find the hot spot by collecting the performance data for very short
intervals, such as, 10 seconds.
Perform the following steps to find the hot spot:
1. Select the affected port (You can find the affected port using HP XP7 Performance Advisor).
2. Select all LDEVs attached to the port.
NOTE: You can use one of the following selection schemes to select the LDEVs:
• Filter LDEVs by RAID Groups
• Filter RAID Groups by LDEVs
• Manually add RAID Groups and LDEVs without Filtering
3. On the output screen, monitor and collect performance data of all the ports.
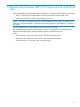
Results
Using the results displayed by HP XPWatch, you can identify the application that is causing the
performance issue and can take the corrective action.
Scenario 2: Poor application response
Business case
The XP or the XP7 disk array is suspected to be the cause of an application’s poor performance.
Objective
Confirm the observation using HP XPWatch.
Resolution
In this case, HP XPWatch can help you to isolate the XP or the XP7 disk array’s performance from
the application’s performance.
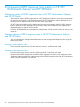
Using HP XPWatch, perform the following steps:
1. Select the host group or server where the application is running. All ports attached to the host
groups are displayed.
2. Select all ports attached to the host groups.
3. Select all LDEVs and RAID groups attached to the ports.
4. On the output screen, monitor and collect performance data for short time intervals, for example,
10 seconds.
64 HP XPWatch use case scenarios