
HP XPWatch and HP XPSketch Reference Guide
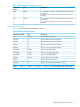
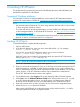
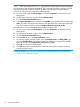
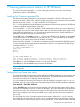
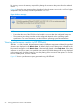
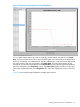
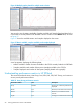
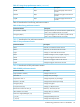
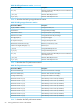

Figure 26 Multiple graphs plotted for multiple metric selection
You can also view the Metrics Available, Samples Available, and Samples Displayed data for the
CSV file that is currently loaded in HP XPSketch. Point to a location on the Metrics label, as shown
in Figure 27.
Figure 27 shows the available metrics and samples displayed on the screen.
Figure 27 Metric available, samples available, and samples displayed
A tool tip appears displaying the following data:
• Metrics Available: number of metrics available in the CSV file currently loaded in HP XPSketch
• Samples Available: total number of data points (samples) available in the CSV file
• Samples Displayed: total number of data points (samples) plotted on the graph(s)
Understanding performance metrics in HP XPSketch
This section describes the Array, Host Group, Port, LDEV, RAID, CPU, DKC Group, and continuous
access journals performance metrics.
Table 25 Array Group performance metrics
DescriptionUnitPerformance metrics
The array for which the performance is
displayed
NumberArray
Minimal I/O rate of the last 60 secondsIO/sMinIO
Maximum I/O rate of the last 60
seconds
IO/sMaxIO
Average I/O rate of the last 60 secondsIO/sAvgIO
58 Viewing performance metrics in HP XPSketch