
HP XPWatch and HP XPSketch Reference Guide


5 Introduction to HP XPSketch
This section gives an overview of HP XPSketch.
Overview
HP XPSketch (earlier known as HP XP P9000Sketch/XPSketch) is a tool provided by HP to enable
you to view the performance metrics of different components of an XP or an XP7 disk array in a
graphical format. The performance metrics obtained on monitoring the selected XP or the XP7 disk
array’s host groups, ports, LDEVs, RAID, CPU, and DKC Groups including the array level metrics
for a specified duration are stored in seven comma-separated files (.csv files) that are generated,
one file for each component.
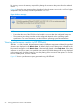
The .csv files generated using HP XPWatch in the Interactive mode can be opened in HP XPSketch
to view a graphical representation of the data.
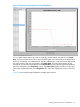
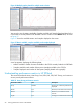
You must load the .csv file in HP XPSketch, which transforms the metrics into various data points
on the graph. You can also select multiple metrics and view the values plotted on the graph. Using
these graphical representations, you can analyze the performance trend, identify bottlenecks or
problems, and take the necessary corrective actions.
NOTE: HP XPSketch does not support the .csv files generated using HP XPWatch in the CLI
mode.
52 Introduction to HP XPSketch