
HP XP7 PA Software User Guide

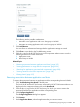

8. Click Start Plotting.
HP XP7 Performance Advisor plots the performance graphs in the Chart Work Area as and
when the real-time performance data is collected for the selected components. For more
information on using charts, see “Plotting charts” (page 234).
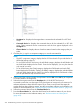
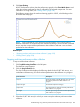
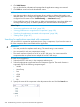
The following image shows the real-time charting graph for 10055, which belongs to the
XP12000 Disk Array type.
NOTE: For the selected XP or XP7 disk array and host agent, if you want to select a
different combination of components for the real-time monitoring or choose another command
device, stop the current real-time performance data collection and start a new real-time
performance data collection.
Related Topics
• “Stopping real-time performance data collection” (page 323)
• “Plotting charts” (page 234)
Stopping real-time performance data collection
To stop a real-time data collection:
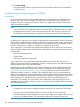
1. Click Troubleshooting+RealTime in the left pane.
The RealTime screen appears.
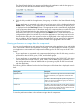
2. Click the Stop Collections tab.
The Stop Collections table displays the following details for the XP/XP7 disk arrays, or a
combination of these arrays, for which real-time performance data collection is in progress:
DescriptionScreen elements
The serial number of the XP/XP7 disk array for which
the real-time performance data collection is in
progress.
Array Id
The selected component category.Component Type
The components for which the real-time performance
data collection is in progress.
Components
The host agent through which the real-time performance
data collection is in progress.
Host Agent
3. Select the XP/XP7 disk array for which you want to stop the real-time performance data
collection.
Troubleshooting using real-time performance data from XP and XP7 disk arrays 323