
HP XP7 PA Software User Guide
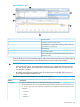
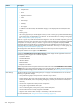
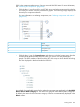
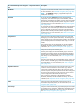

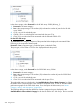

Figure 28 Charts screen
Charts controls1
Component selection tree for charts2
Available Metrics Choose Metric Category list from where you
select metrics for components
3
Chart settings4
Zoom preview panel5
Chart window (blue border indicates that the chart window is
selected or active)
6
Click the black Up arrow positioned at the top right corner of the Data Source and Chart Settings
sections to collapse those sections. Click the black Down arrow to restore the sections.
IMPORTANT:
• In the Chart Work Area, plot performance graphs for any combination of the XP and the
XP7 disk arrays, metrics, and components. Ensure that the components you select do not
exceed 256 in number.
• By default, the performance graphs in the Chart Work Area are plotted only for the last 1
hour of the management station's time.
The Charts screen layout is divided into the following sections:
DescriptionSections
Includes the component selection tree that displays the following main nodes:Data Source
• The XP and the XP7 disk arrays monitored by HP XP7 Performance Advisor. When you click an XP
or an XP7 disk array, the respective components are displayed under the following main
categories:
◦ Front-end
◦ Cache
◦ Back-end
Charts screen 231