
HP XP7 PA Software User Guide


For an XP7 disk array, the average utilization of an individual MP blade by the associated
consumer is displayed under the Util % column. The average utilization is over the specified threshold
duration. In addition, the following details are displayed for the selected MP blade.
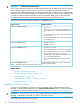
Additional detailsComponents Information section
The consumer ID.Consumer
The type (LDEV, continuous access journal group, E-LUN) to
which the consumer belongs.
Consumer Type
The processing type that is utilizing the assigned MP blade to
process the consumer requests. For more information on
processing types, see Table 24 (page 274).
Processing Type
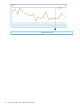
To view the performance of component records or usage graphs in the Chart Work Area section,
select the component records and click Plot Charts. For more information, see “Dashboard charts”
(page 114).
Dashboard charts
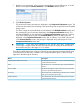
The performance or usage graphs are displayed in the Charts Work Area section for the frontend,
cache, backend, and the MP blade components, only if the respective categories display the
following status icons in the XP/XP7Array Health section:
• Major ( )
• Critical ( )
• Normal ( )
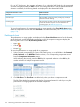
To view the performance or usage graph for a component:
1. Select a record corresponding to a port, CLPR, RAID group, or an MP blade in the Frontend,
Cache, Backend, or the MP Blade Statistics section, or a corresponding component record
from the Components Information section.
While selecting the records, press the Shift key for sequential selection or the Ctrl key for
random selection of multiple component records.
2. Click Plot Chart. The Plot Chart is enabled only when you select a component record.
The Plot Chart dialog box appears with the list of supported metrics for which you can plot
performance or usage graphs of the selected component.
114 Monitoring performance of XP and XP7 disk arrays