
HP XP7 PA Software User Guide

• The average utilization of an ACP/DKA pair
• The average utilization of an MP blade
IMPORTANT:
• The average CHA MPs and the DKA MPs utilization metrics are applicable only for the
XP disk arrays.
• The average MP blade utilization metrics is applicable only for the XP7 disk arrays.
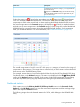
2. During the specified threshold duration, if the usage of any component crosses the defined
threshold limit for any metric in a particular category, the appropriate status icons appear in
the Frontend, Cache, Backend, or the MP Blade category in the XP/XP7Array Health section
and beside the respective components in the Statistics section. The average usage summary
of individual components is also displayed in the Statistics section.
If the threshold limit is defined for at least one metric in a particular category, the respective Statistics
section displays the average usage data of components for all the metrics in that category.
However, the overall usage status of an XP or an XP7 disk array in that category is based on the
usage of components for only those metrics whose threshold limits are configured on the
Threshold Setting screen.
For example, assume that the threshold limit is set only for the RG Seq Reads (IOPS) (Avg Seq
Reads) metric in the Backend category. So, the status icon displayed in the XP/XP7Array Health
section in the Backend category is based on whether the usage data of individual components for RG
Seq Reads (IOPS) (Avg Seq Reads) metric is within or beyond the set threshold limit. However, when
you click the status icon in the Backend category, the average usage data of components
displayed in the Statistics section includes data for the following backend metrics in addition to
the RG Seq Reads (IOPS) (Avg Seq Reads) metric:
• RG NonSeq Reads (IOPS) (Avg NonSeq Reads)
• RG Writes (IOPS) (Avg Writes)
• RG Util (%)
• Avg DKA Pair Util (%)
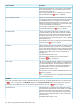
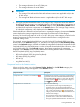
Component levels in the Statistics section
When you click a status icon in the Frontend, Cache, Backend, or the MP Blade category, the
related component usage data appears in the Statistics section.
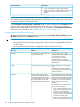
DescriptionComponent levels
Indicates that the usage of a component corresponding to
a particular metric has crossed the threshold limit during
Components with a red status icon beside them ( )
the specified threshold duration. In such cases, the status
icon also appears as for the appropriate category in
the XP/XP7Array Health section.
Can include the following:Components shown as black text
• The components whose usage corresponding to a
particular metric is at 95% of the threshold limit or
higher during the specified threshold duration. The status
icon in such cases appears as in the appropriate
category, if there are no other components that are over
utilized in that category.
• The components whose usage corresponding to a
particular metric is within 95% of the threshold limit
during the specified threshold duration. The status icon
Viewing dashboard 109