HP XP7 Performance Advisor Software User Guide(v6.1) Abstract This document describes how to use the HP XP7 Performance Advisor Software product and includes information about user tasks and troubleshooting. This document is intended for users and HP service providers who have knowledge of the HP XP7 Performance Advisor and XP7 disk arrays hardware, software, and storage systems. For the latest information about this product, see the HP XP7 Performance Advisor Software Release Notes.
© Copyright 2014 Hewlett-Packard Development Company, L.P. Confidential computer software. Valid license from HP required for possession, use or copying. Consistent with FAR 12.211 and 12.212, Commercial Computer Software, Computer Software Documentation, and Technical Data for Commercial Items are licensed to the U.S. Government under vendor's standard commercial license. The information contained herein is subject to change without notice.
Contents 1 Introduction to HP XP7 Performance Advisor.................................................10 Overview..............................................................................................................................10 2 Working with the HP XP7 Performance Advisor GUI......................................11 Introduction............................................................................................................................11 Title bar...............................
Stopping performance data collection schedules....................................................................69 Restarting performance data collection schedules...................................................................69 Deleting performance data collection schedules.....................................................................70 Setting the java heap size values.........................................................................................
Configuring notification and monitoring settings.......................................................................120 Filtering records based on metrics and alarm status..............................................................120 Setting threshold level.......................................................................................................121 Configuring alarm notifications..........................................................................................
Viewing Smart and ThP pools data for P9500/XP7 disk arrays...................................................197 Viewing continuous access data for XP and XP7 disk arrays.......................................................202 CA link status metrics.......................................................................................................205 Viewing 10 busiest LDEVs and Ports........................................................................................
Deleting favorite charts............................................................................................280 Creating reports for favorite charts................................................................................280 Printing charts.............................................................................................................282 Changing the Chart Work Area layout...........................................................................
Viewing performance or usage data for components............................................................329 Viewing data for prominent set of metrics.......................................................................332 Viewing data for additional metrics...............................................................................335 Viewing variations in the LDEV response time......................................................................336 Plotting charts.................................
ACP utilization report.......................................................................................................373 ACP Utilization report..................................................................................................373 ACP Utilization by Hour of the Day report......................................................................374 CHIP utilization report......................................................................................................
1 Introduction to HP XP7 Performance Advisor Overview HP XP7 Performance Advisor Software collects, monitors, and displays the performance of XP and XP7 disk arrays. HP XP7 Performance Advisor collects performance data for individual components such as LDEV, CHIP/CHA, ACP/DKA, DKC, and MP blades (applicable for onlyXP7 disk arrays).
2 Working with the HP XP7 Performance Advisor GUI Introduction The HP XP7 Performance Advisor screen has the following sections: • Title bar • Left pane • Right pane The left pane and the title bar are common to all the HP XP7 Performance Advisor screens. The Dashboard screen appears soon after you log on to HP XP7 Performance Advisor. The main functionalities of HP XP7 Performance Advisor can be accessed using the respective links in the left pane.
◦ HP XPWatch ◦ HP XPSketch ◦ HP XPInfo You can also download the HP XP7 Performance Advisor documentation from the Support screen. IMPORTANT: The HP XPSketch and HP XPInfo were called P9000Sketch and P9000Info in the pre-6.0 versions.
Right pane The right pane displays the screen based on the menu that you select in the left pane. You can select related options on these screens to achieve the desired output. A tool tip is provided for every screen element, which provides a brief description of the screen element. The right pane also displays the Chart Work Area for those screens that require viewing the performance graphs for selected components.
• Columns are sorted depending on the type of information that appears in the respective columns (alphabetical, numerical, or date related). For example, the Metric column on the Alarm History screen sorts in an alphabetical order. The Value column sorts based on the numbers first followed by the alphabets. Resizing columns To resize a column width in a table: 1. Place the cursor of your pointing device on the column separator. The pointer or cursor changes as shown in the following image. 2.
Common tasks 15
3 Managing licenses for XP and XP7 disk arrays This chapter discusses the following topics: • “Introduction” (page 16) • “Instant-on license on HP XP7 Performance Advisor installation” (page 19) • “Instant-on license expiration” (page 20) • “Grace period expiration” (page 21) • “HP XP7 Performance Advisor licenses” (page 22) • “Generating licenses” (page 30) • “Installing licenses” (page 31) • “Viewing aggregate License status” (page 33) • “Viewing status for individual licenses” (page 33)
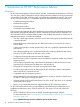
Table 1 License management during installation or upgrade (continued) Installation or upgrade License management array, and install the license key on HP XP7 Performance Advisor. When you upgrade HP XP7 Performance Advisor from v5.4 or later to v6.0, and HP XP7 Performance Advisor was in the Instant-on period HP XP7 Performance Advisor continues to be in that state after the upgrade, until the Instant-on period expires or you generate a Permanent license for the monitored XP/XP7 disk arrays.
Figure 2 License screen Screen elements Description Add New License File In this section, add the licenses (.dat files) that you generated at the HPAC license key website. License Status In this section, view the status of all the Permanent licenses installed on HP XP7 Performance Advisor. It displays the aggregate of all valid license capacities for each XP or XP7 disk array monitored by HP XP7 Performance Advisor.
Related Topics • “HP XP7 Performance Advisor licenses” (page 22) • “Generating licenses at the HPAC license key website” (page 30) • “Instant-on license on HP XP7 Performance Advisor installation” (page 19) • “Instant-on license expiration” (page 20) • “Grace period expiration” (page 21) Instant-on license on HP XP7 Performance Advisor installation The Instant-on license or the trial license is provided with every instance of HP XP7 Performance Advisor.
The Performance Advisor trial license expire on month, day, year. Please contact your HP Representative to purchase the requisite Performance Advisor licenses to avoid disruption of Performance Advisor services. Where, month, day, and year is calculated as 120 days from the date when you install HP XP7 Performance Advisor.
Table 2 (continued) Screen elements Description The above status message is also displayed on the Dashboard screen.
performance data for the current internal raw disk capacities of the monitored XP disk arrays or usable capacities of the monitored P9500 disk arrays. • Configured alarms, notifications, reports, charts, and all other functions continue to work. However, the generated report contains a warning message for license expiry at the beginning of the report. WARNING: License violation was detected for this array.
After installing a Permanent license, if you increase the internal raw disk capacity or the usable capacity beyond the Permanent licensed capacity, the existing Permanent license cannot be used. HP XP7 Performance Advisor considers it as a license capacity violation and initiates a grace period of 60 days for that XP or XP7 disk array.
IMPORTANT: • Additional usable capacity refers to the usable capacity that is beyond the Permanent licensed capacity. • A Meter based Term license cannot be installed on multiple management stations. • Multiple Meter based Term licenses can be generated and installed on a management station. In such cases, the licenses are used successively.
Generate 1950TB-Days of Meter based Term license to monitor 50TB additional usable capacity for 39 days. The 1950TB-Days are derived based on the following calculation: 50TB * 39 days = 1950TB-Days of Meter based Term license The following figure illustrates the scenario described. So, 50TB usable capacity is monitored every day beginning December'10 for the next 39 days.
At the time of installing the Meter based Term license, if the usable capacity is within the Permanent licensed capacity, the installed TB-Days remain dormant till the usable capacity exceeds the Permanent licensed capacity. They are activated only after the Permanent license is completely used. The TB-Days are used for the duration when the usable capacity exceeds the installed Permanent licensed capacity and the exceeded capacity can be managed by the installed TB-Days.
Consider that the usable capacity exceeds the 50TB Permanent licensed capacity by 10TB in the first half of 12/03/2010. As a result, the 90TB-Days are activated and HP XP7 Performance Advisor uses 10TB-Days, and updates the following fields after 1:00 PM on the same day. On 12/03/2010: Column Headings - License Status section Description License Capacity Displays 50TB, +80TB-Days This is because, 10TB-Days are used on 12/03/2010 to monitor the additional 10TB usable capacity on that day.
Column Headings - License Status section Description License Status Displays Capacity Insufficient. End Date Displays Expired. The License Capacity continues to display every day reduction in TB-Days till 02/08/2011 (60th day). The remaining fields listed in the above table remain the same.
• Term (Days): 9 • End Date: 12/10/2010 Nine days count from 12/02/2010 If 85.5TB is used during the first half of 12/03/2010 and no additional TB-Days are used for the rest of the day, HP XP7 Performance Advisor uses 86TB-Days and considers the 0.5 days as one day.
4. 5. 6. If the usable capacity rises beyond the 25TB Permanent licensed capacity on 11/30/2010 and 3.5TB is used on the same day, HP XP7 Performance Advisor considers 4TB-Days. If there has been no activity from 11/30/2010 till 12/28/2010, the remaining 8TB-Days are not used. If 4TB is used on 12/29/2010 followed by another 4TB on 12/30/2010, HP XP7 Performance Advisor considers 4TB-Days on each day, and the 8TB-Days are completely used by 12/30/2010.
5. • Additional PA LTU that you purchased • Internal raw disk capacity or usable capacity that the LTU supports Provide the following details on the Array information input screen: • Enter the Array DKC serial number, which is a five digit number, such as 10900, 53036. • Select the Hardware platform from the list. The supported XP7 disk array and the XP disk array models, such as P9500,XP24000, XP20000, XP12000, XP10000 are displayed for selection. 6. Click Next >>.
5. Click Add License. CAUTION: After the licenses are installed, do not modify the date and time on the management station where HP XP7 Performance Advisor is installed. Modifying them may result in inaccurate configuration and performance collections. The following details are updated in the View License File Status section.
Related Topics • “Viewing aggregate License status” (page 33) • “Viewing status for individual licenses” (page 33) • “Removing licenses” (page 41) Viewing aggregate License status HP XP7 Performance Advisor maintains the following for an XP or an XP7 disk array, if you have generated and installed licenses for that disk array on HP XP7 Performance Advisor: • An aggregate of internal raw disk capacities in an XP disk array • An aggregate of usable capacities in an XP7 disk array If a Meter based Ter
3. Click View Details. The View License Detail section appears. The following image shows the license details for 53036, which belongs to the P9500 Disk Array Type. In addition to the details displayed in the License Status section, the following details specific to the installed license appear in the View License Detail section: Screen elements Description Key Type Displays the license type.
Screen elements Description Licenses Available Displays the available license capacity. • If you select an XP disk array record, this column always displays the Installed License Capacity value. • If you select an XP7 disk array record whose usable capacity is monitored using only a Permanent license, this column displays the Installed License Capacity value. • In case of Meter based Term licenses: 1.
Screen elements Description Expired Date If you select an XP or an XP7 disk array record whose usable capacity is monitored using only a Permanent license, this column is blank as the Permanent license is for an unlimited duration. In case of Meter based Term licenses: • If you select an XP7 disk array record for which both the Permanent license and TB-Days of Meter based Term license are installed, and the installed TB-Days are dormant, this column is blank.
Exceeding Permanent licensed capacity and grace period When the internal raw disk capacity of an XP disk array or the usable capacity of an XP7 disk array exceeds the Permanent licensed capacity, HP XP7 Performance Advisor switches to the grace period of 60 days for that particular disk array. The License Status for such XP or XP7 disk arrays displays Capacity Insufficient in the View License Status section.
• ◦ Term (Days): N/A ◦ End Date: Never After 1:00 PM on 11/30/2010: ◦ License Capacity: 50TB, +100TB-Days Consider that 25TB-Days are used after installation.
Consider the following points: 1. An XP7 disk array has a usable capacity of 50TB. 2. A Permanent license is installed on 11/23/2010 to monitor the 50TB usable capacity. 3. Due to a surge in storage requests around 11/30/2010, another 10TB usable capacity is added for a duration of five days. 4. Because this is a short term unplanned request, it is addressed by installing 50TB-Days of Meter based Term license on 11/30/2010. 5.
5. As the usable capacity is beyond the Permanent licensed capacity, HP XP7 Performance Advisor uses the 100TB-Days of Meter based Term license. Based on the usable capacity consumed, HP XP7 Performance Advisor uses the appropriate TB-Days of Meter based Term license. Following are sample consumptions from day 1 to day 3: 6. • 11/30/2010: 51.5TB monitored using 52TB-Days • 12/01/2010: 20.3TB monitored using 21TB-Days • 12/02/2010: 24.
During a capacity violation phase, if you do one of the following: • Install a Permanent license for HP XP7 Performance Advisor to monitor the XP disk array. Install a Permanent license or appropriate TB-Days of Meter based Term license for HP XP7 Performance Advisor to monitor the XP7 disk array. • Reduce the internal raw disk capacity of the XP disk array or the usable capacity of the XP7 disk array to match the Permanent licensed capacity.
case, HP XP7 Performance Advisor considers it as capacity insufficient violation and enters a grace period for that disk array. You can install the required TB-Days of Meter based Term license to end the grace period. If the TB-Days count is negative, the removal of the Meter based Term license is not allowed.
5. Click Yes. The message indicating the removal of the license appears on top of the Remove License dialog box. Once the Meter based Term Licenses are removed, you cannot install it again on the same management station. However, it can be installed on a different management station. The available capacity will be same as the license capacity of the Meter based Term license key.
4 Collecting configuration and performance data This chapter discusses the following topics: • “Introduction” (page 44) • “Configuring host information” (page 46) • “Configuration data” (page 49) • “Performance data” (page 58) Introduction HP XP7 Performance Advisor interacts with the XP and the XP7 disk arrays through hosts that have the operating system specific HP XP7 Performance Advisor host agents installed.
NOTE: • HP XP7 Performance Advisor also collects the real-time performance data from the XP and the XP7 disk arrays. For more information, see “Troubleshooting using real-time performance data from XP and XP7 disk arrays” (page 317). • To distinguish the external parity group from the normal parity group in case of an outband collection, the external parity group fb4 number is displayed between the range of 101 to 16484.
Screen elements Description Configuration Collection Displays the list of command device records in the Configuration Collection table. You can select a command device and perform a one-time configuration data collection, or schedule a configuration data collection for the corresponding XP or XP7 disk array. Performance Collection Displays the list of XP and XP7 disk array records in the Performance Collection table.
Related Topics • “Collecting configuration data” (page 52) • “Scheduling configuration data collection” (page 54) • “Performance data” (page 58) Requesting host agent updates Prerequisites Ensure that the following prerequisites are met: • Ensure that the version of the host agent installed on the host matches with the version of HP XP7 Performance Advisor installed on the management station.
4. Click Request Info. The Request Info button is enabled only when you select the host agents. Use the Shft or the Ctrl key to select multiple host agent records. The request is executed in the subsequent data collection cycle. Following is the sequence of events that occur for the selected host agent: a. HP XP7 Performance Advisor retrieves the updated information from the host agent. This may take a few minutes depending on the number of LDEVs that are exposed to the host agent.
4. Click Remove Host. The Remove Host button is enabled only when you select a host agent record. HP XP7 Performance Advisor deletes the host agent record and logs a confirmation on the Event Log screen. When you remove a host agent, information about the command devices and the following data for the XP and the XP7 disk arrays connected to the host agent are also removed.
Screen elements Description Array Displays the DKC number and the user-friendly name of the XP/XP7 disk array. Host ID Displays the system name of the host. Port Displays the port that is configured to communicate data between the command device (on an XP or an XP7 disk array) and the associated host agent. Cmddev Displays the ID of the LDEV that is configured as a command device. DeviceFile Displays the device file for the command device.
The following are important notes applicable for both the one-time and scheduled configuration data collection: • Select only one command device for an XP or an XP7 disk array to perform the configuration data collection for that array. • When a configuration data collection is in progress for an XP or an XP7 disk array, do not initiate another configuration data collection for the same array.
Tasks you can perform under the Configuration Collection tab • “Collecting configuration data” (page 52) • “Scheduling configuration data collection” (page 54) One-time configuration data collection Prerequisites Ensure that the following prerequisites are met before you start the configuration data collection for the XP and the XP7 disk arrays.
5. Based on the disk array that you selected, following are the further course of steps: If you selected an XP disk array and outband mode of configuration data collection: • Manually enter the SVP IP address in the SVP IP Address text box and proceed to next step to initiate the configuration data collection. If you already registered the XP disk array SVP with the respective management station, the corresponding SVP IP address is displayed in the SVP IP Address text box.
Scheduling configuration data collection IMPORTANT: The schedule start time is set to the management station time where HP XP7 Performance Advisor is installed. Prerequisites For the set of prerequisites, see “Collecting configuration data” (page 52). To schedule configuration data collection: 1. Click Monitoring+Array View in the left pane. The Array View screen appears. 2. 3. Click the Configuration Collection tab.
Figure 5 Configuration Data Collection 5. Select one of the following as the Collection Schedule. By default, the collection is scheduled for every Sunday at 00:00 hours: • Hourly • Daily • Weekly • Monthly For more information on the above-mentioned collection schedules, see “Configuration collection schedules” (page 57). 6. By default, the Collection Type is Outband, as HP XP7 Performance Advisor directly collects data from the XP/XP7 disk array through the array SVP. Proceed to next step.
7. Based on the disk array that you selected, following are the further course of steps: If you selected an XP disk array and Outband mode of configuration data collection: • Manually enter the SVP IP address in the SVP IP Address text box and proceed to next step to initiate the configuration data collection. If you already registered the XP disk array SVP with the respective management station, the corresponding SVP IP address is displayed in the SVP IP Address text box.
• “Viewing performance summary” (page 177) • “Plotting charts” (page 234) Configuration collection schedules The following table describes the configuration collection schedules. Collection Schedule Description Hourly If the collection schedule is selected as Hourly, the Hourly Schedule If you create an hourly schedule list appears. Select the schedule frequency as 1 hour, 6 hours, or at 12:30 PM and set the schedule 12 hours.
1. Click Monitoring+Array View in the left pane. The Array View screen appears. 2. 3. 4. Click the Configuration Collection tab. The Configuration Collection table displays the list of command device records for all the XP and the XP7 disk arrays that are monitored by HP XP7 Performance Advisor. Select the command device record corresponding to the XP/XP7 disk array for which you want to delete the configuration data schedule. Click Delete Schedule.
NOTE: If you plot performance graphs when the configuration data collection is in progress, there are gaps in the data points. These gaps indicate that the performance data is not collected during the configuration data collection time interval. • While creating a performance data collection schedule, you can select a command device that is mapped through two different ports.
• If you split the external RAID groups, RAID groups, ThP pools, and the snapshots into two schedules, you cannot see the Total I/O, Total MB/s, and the Total Tracks fields in the LDEV table. • If you split the journal LDEVs, external RAID groups, RAID groups, ThP pools, and the snapshots into two schedules, and in charts, you select All from the LDEV drop-down box, the combined data points from both the schedules are plotted on the chart.
Example use cases The following are the example use cases for understanding the split performance data collection schedules: 1 Scenario Activity One Activity Two2 1 • The first schedule contains all components • The RG components are removed, and only the associated with the DKC and Port component types. components associated with the DKC and Port It also includes some components associated with component types are saved in the first schedule. the RG component type.
Creating performance data collection schedules IMPORTANT: • Only one schedule can be created on a selected command device. For a better performance, select a maximum of two command devices that belong to different ports. • A schedule cannot be created for the same XP or XP7 disk array through two different host agents. • HP recommends that you should allow two minutes per 1,000 LDEVs for the management station to keep up with the collection.
Advisor validates the following and displays appropriate error messages if the validations fail: 4. • If it is the first performance data collection schedule, HP XP7 Performance Advisor verifies if the configuration data is already available for that XP or XP7 disk array.
NOTE: • The THP Group(s), CA Journal Group(s), and the SNAP Group(s) component type lists are displayed only if the corresponding components are configured on the selected XP/XP7 disk array. The External RG(s) component type list is displayed only if the external volumes are attached to the selected XP/XP7 disk array. • Selecting a ThP, snapshot, or a continuous access journal volume also provides the respective volume pool information.
8. Select the Stagger Collection check box if you want to stagger the data collection time at different intervals. For example, if the Stagger Collection check box is not selected, and Frequency is set to 15 minutes, performance data collection occurs every fifteen minutes, irrespective of when the schedule is created. For example, if the schedule is created at 10.12 a.m., the first collection occurs immediately and the next collection occurs at the quarter of the hour, which is 10.15 a.m.
• Create custom groups for a set of LDEVs that you want to frequently monitor. For more information, see “Creating custom groups” (page 84). • Create and schedule reports to view the performance data of components for different metrics, and duration that you specify. For more information, see “Generating, saving, or scheduling reports” (page 298). In case of performance data collection failures, the appropriate failure messages are displayed on the Event Log screen.
Scenarios Automatic updates What happens... collection schedule later to add or remove components from Schedule 1. Two schedules created (Schedule 1 and Schedule 2) Enabled Schedule 1 for automatic updates. The newly discovered RAID groups and ports are automatically appended to the existing list for which Schedule 1 is in progress. The performance data collection continues for the new components also.
Starting performance data collection in case of a disk failure The performance data collection might stop on all the XP and the XP7 disk arrays connected to a host, if the command device used belongs to an array group where a disk failure occurred. To restart performance data collection: 1. Under the Host Information tab, select the host (on which performance data collection has stopped) and click Request Info.
Related Topics • “Viewing a performance data collection schedule” (page 68) • “Starting performance data collection” (page 69) • “Stopping performance data collection” (page 69) • “Deleting performance data collection schedule” (page 70) • “Starting real-time performance data collection” (page 320) Stopping performance data collection schedules To stop a performance data collection schedule: 1. Click Monitoring+Array View in the left pane. The Array View screen appears. 2. 3.
icon appears under Enabled for the selected XP/XP7 disk array record indicating that the schedule has started.
3. If you type y at the prompt, you are further prompted to provide the minimum and maximum java heap size values. The minimum heap size value must be more than or equal to 512 MB, and the maximum heap size value must be less than or equal to 2048 MB. If heap size values are already set, the current minimum and maximum heap size values are also displayed for your reference. If you type n at the prompt, the command prompt window closes. 4.
5 Configuring common settings for HP XP7 Performance Advisor This chapter discusses the following topics: • “Introduction” (page 72) • “Configuring email and SNMP settings” (page 73) • “Setting time zone for management station” (page 79) • “Setting severity level” (page 78) • “Registering the XP or XP7 disk array SVP IP address in HP XP7 Performance Advisor” (page 77) • “Providing user-friendly names for XP and XP7 disk arrays” (page 76) In addition, this chapter also discusses the following top
IMPORTANT: You must log on to HP XP7 Performance Advisor as an administrator or a user with administrator privileges to perform the above-mentioned tasks. However, the administrator privileges are not required to manage the custom groups and the fabricated LDEV records. You can also configure the following specific settings: • Set the threshold limits (PA and DB Settings+Threshold Setting) and monitor the overall usage of the XP and the XP7 disk arrays on the Dashboard screen.
IMPORTANT: • The new email notification settings that you provide are automatically updated in the serverparameters.properties file. Hence, a manual reboot of the HP XP7 Performance Advisor management station is not required. • The Email Address is a mandatory field. Provide a valid destination email address that receives the email notifications when the alarms and reports are generated, or the performance data collection fails. For example, test1@xyz.
The default destination email address for receiving the alarm notifications is administrator@localhost • An appropriate subject text for the alarm email notifications. HP XP7 Performance Advisor uses the specified subject line as the default subject line for all the notifications that are dispatched when a component is performing beyond the set threshold limit. The default subject line is XP7 Alarm. • An appropriate title text for the Good Information alarm (recovery alarm) email notifications.
Trap not dispatched. It might be due to invalid IP address or server name, or the SNMP server is not accessible. 4. Click Save. A message appears to indicate that the settings are updated in the serverparameters.properties file. Click OK to start using HP XP7 Performance Advisor. If you click Cancel, the previous specified values are retained in the in the serverparameters.properties file and also displayed on the Email Settings screen.
Related Topics • “Collecting configuration data” (page 52) • “Scheduling configuration data collection” (page 54) • “Performance data” (page 58) Registering the XP or XP7 disk array SVP IP address in HP XP7 Performance Advisor You can register the SVP of an XP or an XP7 disk array with the respective management station that has HP XP7 Performance Advisor monitoring these disk arrays.
4. Click Register. The SVP IP address that you specify is registered with the management station. HP XP7 Performance Advisor automatically uses the SVP IP address every time you initiate an outband configuration data collection for the selected XP disk array. To register an P9500/XP7 disk array SVP IP address with the management station: 1. In the Register SVP IP/Save RWC Credentials section, select an P9500/XP7 disk array from the Array list.
NOTE: This change affects only those messages that are created after you instigated the severity change. All messages that were logged before you set the severity level still remain in the HP XP7 Performance Advisor database and appear on the Event Log screen. To set the severity level: 1. Click PA and DB Settings+User Settings in the left pane. The User Settings screen appears. 2. 3.
Complete the following steps to select the duration: 1. Click PA and DB Settings+User Settings in the left pane. The User Settings screen appears. 2. 3. In the Data Analysis Settings section, select the duration from the drop-down list. You can select a maximum of seven days. By default, HP XP7 Performance Advisor considers a duration of two days for the prediction. Click Save. HP XP7 Performance Advisor does the following: 1.
If the HP XP7 Performance Advisor Tomcat service is manually stopped, the HP XP7 Performance Advisor Monitor service does not take any action, which includes not sending any email notifications. The following messages appear in the jakarta_service_.log file located in the \pa\tomcat\logs folder if the HP XP7 Performance Advisor Tomcat service is manually stopped.
NOTE: • If you configure the SMTP parameters but do not specify a retry count, the HP XP7 Performance Advisor Monitor service does not attempt to restart the HP XP7 Performance Advisor Tomcat service. Also, it does not dispatch any notification to the intended recipients. • If you do not configure the SMTP parameters but specify the retry count, the HP XP7 Performance Advisor Monitor service attempts to restart the HP XP7 Performance Advisor Tomcat service.
Configuring SMTP parameters To receive email notifications on the status of tomcat and database services, complete the following steps: 1. Click PA and DB Settings+Email Settings in the left pane. The Email Settings screen appears. 2. In the Performance Advisor Monitor Settings section, provide the destination email address and the email subject. It is mandatory to provide the destination email address. You can provide multiple email addresses. 3. Click Save.
The following are important notes on custom groups: • The LDEVs associated with multiple RAID groups or multiple ACPs are treated as separate group of items. For example, if you have an LDEV associated with the RAID group 1-1 1-2, you must select 1-1 1-2 in the RAID Groups list. An LDEV mapped to the RAID group 1-1 1-2 is treated separately from an LDEV mapped only to the RAID group 1-1 or 1-2. • If HP XP7 Performance Advisor is upgraded from v3.
Related Topics • “Viewing custom groups configurations” (page 86) • “Editing custom groups” (page 88) • “Deleting custom groups” (page 89) • “Plotting charts” (page 234) Using custom group filters You can also use the following custom group filters to view specific set of LDEV records in the Custom Groups table: • Arrays: Array Names list • Hosts list • ACPs list • Ports list • RAID Groups list The selection in each filter is independent of the selection in other filters.
You can create two custom groups to group all the LDEVs that belong to both the P-VOLs and S-VOLs, so that you can monitor only the selected LDEVs. By creating the custom groups, you can: • View and analyze the performance trends of only the selected LDEVs (irrespective of the XP and the XP7 disk arrays or the CUs they belong to). • Plot a graph for a metric of your choice and view a graphical representation of the LDEVs performance for that particular metric when the workload was maximum.
3. Click View. The View button is enabled only when you select LDEV records in the Custom Groups table. The View Custom Group Details screen appears providing the list of LDEVs added to the selected custom group. The following table describes the column headings in the Group Details screen. Table 7 Group Details screen Screen elements Description DKC Displays the IDs of the selected XP and XP7 disk arrays.
Table 7 Group Details screen (continued) Screen elements Description Host Group Displays the host group name for the host. The host group name is a user-defined group on an XP or an XP7 disk array. ACP Pairs Displays the selected ACP pairs. RG Displays the selected RAID groups. Jnl Displays the identification numbers of the continuous access journal groups.
The records are removed and the list is refreshed. Click X on the View Custom Group Details screen title bar to close the window. Deleting custom groups To delete a custom group: 1. Click Customize Settings+Custom Groups in the left pane. The Custom Groups screen appears. 2. 3. Select a custom group from the list under List of Custom Groups. Click Delete. The Delete button is enabled only when you select a custom group under List of Custom Groups.
Screen elements Description Volume Group Displays information for a particular volume group. Emulation Displays the emulation types. An array group is divided into open volumes of the same size. These volumes are called emulation types. SSID Displays the SSID. RG Displays the RAID group to which the host belongs. Jrnl Group Displays the identification number of the continuous access journal group. ACP Pair Displays the identification number for the ACP pair.
• Host Group list • Target: LUN list • Volume Group list • Device File list • RG list • LDEV list The selection in each of the above-mentioned filters is independent of the selection in the other filters. 3. Click Query. The existing list is filtered to display the set of fabricated LDEV records based on your selection.
NOTE: If you enter values in the text boxes (see step 4) and also in the Data Grid Update table text boxes, HP XP7 Performance Advisor considers the values entered in the text boxes displayed above the list of LDEV records. IMPORTANT: The following fields are checked against a specific criteria: • Target:LUN: Target >=0 and <=128, LUN >=0 and <=2048. • SSID: >=-1 and <=256. If a value -1 is displayed in any of the columns, you may want to edit the column and submit it to the database. 4.
4. 5. • Volume Group • Device File • SSID Clear the selection for the existing record and select the check boxes for those LDEV records that you want to apply the template for. Use the Shift key or Ctrl key for selecting multiple component records. Click Update Records. The values displayed in the above text boxes are replicated accordingly across the selected set of LDEV records.
Creating a user record To create a new user record: 1. Click PA and DB Settings+Security in the left pane. The Security screen appears. 2. 3. 4. Click New. Enter the following details for the user in the popup window that appears: • The name of the new user and a brief description about the user profile. • A password. • Confirm the password. • Assign the user to a group. The Select a Group list displays Administrators and StorageAdmins (read and write access), and Users (read access) privileges.
3. Click Delete. Click Yes in the popup window that appears, to permanently delete the user record. Click No to retain the user record. Related Topics • “Creating a user record” (page 94) • “Changing password” (page 94) • “Viewing group properties” (page 95) Viewing group properties To view the properties of a group: 1. Click PA and DB Settings+Security in the left pane. The Security screen appears. 2. 3. Select a user record from the list of records displayed under Groups. Click Properties.
6 Monitoring performance of XP and XP7 disk arrays This chapter discusses the following topics: • “Introduction” (page 96) • “Configuring dashboard threshold settings” (page 98) • “Viewing dashboard” (page 105) Introduction HP XP7 Performance Advisor provides a dashboard, where you can view the overall usage status of the XP and XP7 disk arrays. The overall usage status is based on the usage of individual components.
For more information on the sections in the Dashboard screen, see “Viewing dashboard” (page 105). For more information on setting thresholds and specifying the X busiest components, see “Configuring dashboard threshold settings” (page 98) and “Specifying the top 20 consumers” (page 101). NOTE: ACP and DKA, CHIP and CHA are terms that are used synonymously across the HP XP7 Performance Advisor screens and in this user guide.
Figure 9 Dashboard screen 1 The Threshold Setting screen where you set the threshold levels. 2 The XP/XP7Array Health section, where status icons are displayed that indicate the overall usage of the XP and XP7 disk arrays in a particular category. 3 The Statistics section, where the average usage summary of individual components are displayed. You can plot their usage graphs in the Chart Work Area.
1. Do one of the following: Click PA and DB Settings+Threshold Setting in the left pane. OR Click Edit Threshold on the Dashboard screen. The Dashboard screen appears by default when you launch HP XP7 Performance Advisor or when you click Monitoring in the left pane.
3. Enter the threshold value. When you set the threshold limits, HP XP7 Performance Advisor verifies the usage of components against the set threshold limits. Accordingly, the appropriate status icons and the average usage summary values are displayed on the Dashboard screen. • If you have not set the threshold limit or if you do not want to view the XP or XP7 disk array overall usage data for a particular category, enter –1 or 0 in the metric text box.
NOTE: 5. • By default, the duration is set to 6 hrs in the Threshold Setting screen. • All the charts in the dashboard screen is displayed for 1 hour if the duration selected is current in the Threshold Setting screen. • Ensure that both the host agents and the management station is in sync. • Ensure that the system clock time on both the host agents and management station is in sync. Click Save. For the selected threshold duration, HP XP7 Performance Advisor does the following: 1.
NOTE: screen. The LDEVs, journal groups, or the E-LUNs are referred as consumers on the Dashboard By default, the consumers are sorted in a descending order and displayed in the Component Information section. The consumers with quicker average read and write response time or a high average MP blade utilization are displayed first, followed by those with higher response time and low average utilization values.
Screen elements Description MBPS The MBPS threshold value indicates the average MB/s that you define an individual port can handle over a specified duration. HP XP7 Performance Advisor uses this value to verify whether the average MB/s value on each port is within or beyond the set threshold. If the average MB/s on a port exceeds the defined threshold limit, the CHA Util (%) status icon appears. The CHA Util (%) threshold value indicates the average overall MPs utilization on an installed CHA.
Screen elements Description HP XP7 Performance Advisor uses this value to verify whether the average sequential I/Os on each RAID group is within or beyond the set threshold limit. If the average sequential I/Os on a RAID group exceeds the defined threshold limit, the RG NonSeq Reads (IOPS) status icon appears. The RG nonseq frontend reads (IOPS) threshold value indicates the average non-sequential backend read tracks that you define an individual RAID group can manage over the threshold duration.
Screen elements Description If the average utilization of one MP blade exceeds the defined threshold limit, the status icon appears. NOTE: The MP Blade Util (%) metric is applicable for MP blades on the P9500/XP7 disk arrays. Viewing dashboard HP XP7 Performance Advisor displays the overall usage summary of the XP and the XP7 disk arrays on the Dashboard screen, which appear after you log on to HP XP7 Performance Advisor.
NOTE: • Click Add New Licenses to add licenses for the XP and the XP7 disk arrays on the License screen. For more information, see “Installing licenses” (page 31). • Click Edit Threshold to specify the threshold limits and threshold duration. • If you have modified the threshold limits for an XP or an XP7 disk array, manually refresh the Dashboard screen to view the updated dashboard status.
Status icon Description Indicates that the particular category is not applicable for the selected array. appears in the MP Blade category for the XP disk arrays, as the MP blade related metrics are applicable only for the XP7 disk arrays. Further, the status icon (Critical) takes precedence over the (Major) and (Normal) status icons.
The following image shows the cache statistics for 10035, which belongs to the XP7 disk array.
• The average utilization of an ACP/DKA pair • The average utilization of an MP blade IMPORTANT: 2. • The average CHA MPs and the DKA MPs utilization metrics are applicable only for the XP disk arrays. • The average MP blade utilization metrics is applicable only for the XP7 disk arrays.
Component levels Description in such cases appears as in the appropriate category, if there are no other components that are over utilized or nearing the set threshold limits in that category. NOTE: You can sort the component records in the Statistics section based on their current state. The critically utilized components are displayed first followed by those components whose usage is nearing or within the set threshold limits.
Category Metrics Description ThP pools, the sum of the backend transfer on all the ThP pools will be shown as combined backend transfer for that RAID group. * is displayed beside the combined backend transfer value to indicate the same. The backend transfer of each ThP pool is the sum of backend transfer on V-Vols belonging to that ThP pool. For example, consider that physical LDEVs 0:00 and 0:01 from RG_1 are contributing to ThP_Pool_1 and 0:02 from RG_1 is contributing to ThP_Pool_2.
IMPORTANT: Combined backend transfers: In Thin Provisioned environments, the overall backend transfers at the RAID group level are reported using combined backend transfer metric. For a Thin Provisioned V-Vol where the ThP pool is associated with multiple RAID groups, the backend transfers are not tracked to the corresponding RAID group level. The backend transfers contributed by all V-Vols in a ThP pool are combined and reported as combined backend transfers for each participating RAID group.
1. Based on your requirement, select a record corresponding to a port, RAID group, or an MP blade in the respective Frontend, Backend, or the MP Blade Statistics section. 2. Click Show Consumers. The maximum X busiest consumers are displayed in the Components Information section. The records are also sorted in the ascending or the descending order as specified on the Threshold Setting screen.
For an XP7 disk array, the average utilization of an individual MP blade by the associated consumer is displayed under the Util % column. The average utilization is over the specified threshold duration. In addition, the following details are displayed for the selected MP blade. Components Information section Additional details Consumer The consumer ID. Consumer Type The type (LDEV, continuous access journal group, E-LUN) to which the consumer belongs.
3. Select the check box for the metric, for which you want to view the performance or usage graph of the selected component, and click OK. HP XP7 Performance Advisor plots the appropriate graphs in the Chart Work Area. The duration for which the data points are plotted in the chart depends on the threshold duration specified on the Threshold Setting screen. By default, the graphs are plotted for data points collected in the last 6 hours of the management station's time.
1 116 Monitoring performance of XP and XP7 disk arrays High watermark level.
7 Configuring alarms and managing events This chapter discusses the following topics: • “Introduction” (page 117) • “Configuring alarms and viewing alarms history” (page 117) • “Managing alarm history” (page 131) • “Viewing events” (page 138) Introduction HP XP7 Performance Advisor enables you to activate alarms on components, so that timely notifications can be dispatched to intended recipients when the performance of components rise beyond a particular limit.
You can also view the corresponding performance graphs for components on which alarms are generated. The following are the high level sequence of steps you must perform to activate alarms and view history for configured alarms: 1. Click PA and DB Settings+Configure Alarms in the left pane. 2. Select components in the component selection tree under Data Source. 3. Select the associated metrics for which the components must be monitored from the Available Metrics Choose Metrics Category list.
Selecting components and metrics You can configure alarms on XP and XP7 disk arrays, corresponding component types, or individual components. To select components and metrics: 1. Click PA and DB Settings+Alarms in the left pane. 2. In the component selection tree under Data Source, select components on which you want to configure alarms. For more information on selecting components and related metrics, see “Selecting components and metrics” (page 236).
Related Topics • “Setting threshold level” (page 121) • “Configuring alarm notifications” (page 122) • “Establishing scripts for alarms” (page 124) • “Enabling or disabling alarms” (page 125) • “Applying a template” (page 126) • “Deleting records in the Alarms table” (page 127) Configuring notification and monitoring settings After you select components and metrics, and click Add alarm(s), records for the components are added to the Alarms table.
2. You can filter alarm records based on: • Array: The Array list displays only those XP and XP7 disk arrays for which alarms are configured. Select the XP or XP7 disk array to view the corresponding alarm records in the Alarms table. Alternatively, you can also select the XP or XP7 disk array in the component selection tree to view the same set of alarm records in the Alarms table.
1. 2. Click PA and DB Settings+Configure Alarms in the left pane. In the Alarms table, select the component records for which you want to specify the threshold level. You can also filter component records in the Alarms table. 3. Enter the threshold level under the Threshold column for each component record. By default, 999999 is set as the threshold level for new component records. The threshold level that you provide for each record is automatically stored in the list under the Threshold column.
For more information on specifying common recipient email addresses for all alarm notifications, see “Configuring email and SNMP settings” (page 73). Prerequisites Ensure that the following prerequisites are met before you configure alarm settings: • A valid source email address, and IP and port addresses of the SMTP servers are specified. For more information, see “Configuring email and SNMP settings” (page 73).
Alarm_Source=Performance Advisor Alarm_Metric_Value = 6D 5F 4D 61 6A 6F 72 5F Alarm_ Component _Value=0:45 Array_ID=53036 Array_Type=P9500 Threshold=10 Time_Detect=2012-09-18 12:49:16 IST Sample SNMP notification for an XP24000 Disk Array Related Topics • “Adding or removing metric values” (page 119) • “Setting threshold level” (page 121) • “Establishing scripts for alarms” (page 124) • “Enabling or disabling alarms” (page 125) • “Applying a template” (page 126) • “Deleting records in the Alarm
Alternatively, copy the script location from an existing record and apply it across multiple other records. For more information, see “Applying a template” (page 126). Sample script file The following is an example of a script file: C:/Temp/a.xml. The format of the XML file should be as follows:
• “Configuring alarm notifications” (page 122) • “Establishing scripts for alarms” (page 124) • “Applying a template” (page 126) • “Deleting records in the Alarms table” (page 127) • “Filtering records in Alarms History table” (page 134) • “Viewing graph of metric value's performance” (page 136) • “Filtering event records” (page 139) Applying a template You can manually configure the threshold and dispatch settings, and alarm notification settings, or use the details from an already configured
You can also select a component record and directly apply specific settings on that record, without using the Copy Template feature. 1. Select the check box for that component record. (You can also select multiple records). 2. In the Settings section, provide the values or settings that you want to update for the selected component record. 3. Click Apply Settings followed by Save.
Searching for components You can navigate the Array tree by selecting an array from the array drop-down list and the component from the component drop-down list. The following components are supported for the search functionality: LDEV, RG, HG, Port, and Pool. You will have to enter a valid input for the particular component, and then click Find Next. On clicking the Find Next button subsequently, you can navigate through all the branches of the Tree in which that particular component is found.
Searching for components 129
Configuring alarms and managing events
NOTE: • For the Raid Group, the Host Group branch is traversed first, followed by the Pool branch, Back-end, and finally the Drive Types branch. • You can search for External Raid Groups as well by selecting Raid Group from the component drop-down list and querying for a specific External Raid Group. • When searching for concatenated Raid groups, you should enter a part of Raid group name and not the entire name.
Related Topics • “Understanding alarms history” (page 132) • “Alarm History screen” (page 132) • “Filtering records in Alarms History table” (page 134) • “Viewing graph of metric value's performance” (page 136) • “Adding or removing metric values” (page 119) • “Configuring notification and monitoring settings” (page 120) Understanding alarms history For HP XP7 Performance Advisor to start monitoring the performance of a component and generate an alarm, you must configure the required threshold a
Figure 11 Alarm History Table 9 Viewing alarm History records Screen elements Description Alarm State Displays the current state of an alarm: Recovery Alarm or Serious Alarm. DKC/Grp (Array Name) Displays the array model to which the selected component belongs. Array Type Displays the array type to which the selected array model belongs. Metric Displays the metric for which a component is monitored.
Table 9 Viewing alarm History records (continued) Screen elements Description Time Dispatched Displays the time stamp when the alarm notification is dispatched to the intended recipient. Status Displays the status on email and SNMP notifications, and script execution. The five possible statuses are listed as follows: • Status 0: Timed Out : in case alarm can not be triggred in the given time(this time is specified in the Email_TimeOut field of the serverparameters.
3. Click Filter. HP XP7 Performance Advisor filters the existing set of records and displays only those that match the selection criteria on the Alarm History screen. The records are displayed in an ascending order. For more information on Alarms History screen, see “Alarm History screen” (page 132). Click Clear Filter any time while selecting values from the filter options. It removes the current selection and display all the records in the Alarms History table.
Screen elements Description latest performance values for all the components are displayed. • Time dispatched: If this option is selected, the time stamps when HP XP7 Performance Advisor dispatched the alarm notifications are displayed. If a record is showing a blank entry for any of these time stamps, that particular record is skipped during the filtering phase. Assuming that the I/Os transactions are not happening on a particular component, and the alarm is also disabled.
or dropped below the threshold level. For a component that has crossed the threshold limit, the performance graph includes the following: • Performance value when the component crossed or dropped below the threshold level. • Includes data collected 1 hour prior to the component crossing or dropping below the threshold level. • Continues to show data collected upto 1 hour after the component crossed or dropped below the threshold level (if performance data is available).
Viewing events HP XP7 Performance Advisor generates events in response to various activities that you perform using this application. Appropriate records are automatically displayed for all the events in the Event Log table. For instance, records are logged for events generated when a performance data collection fails or the collection schedule is restarted. The Event Log screen is displayed when you click Monitoring+Event Log in the left pane.
Tasks you can perform on the Event Log screen • “Filtering event records” (page 139) • “Deleting event records” (page 140) Filtering event records You can filter event records based on the duration when the events are logged, type, and severity of events logged. You can also do a quick text based search that works only on records displayed in the current page. For search based on text entries: 1. Click Monitoring+Event Log in the left pane. The Event Log screen appears.
Though you would have already set the severity level for event logging, this filter also displays the severity levels applicable to all events logged before you set the severity level. It is useful in cases where yo want to view events generated prior to setting the severity level. 5. Click Find. The existing list is filtered to display the set of event records that are matching the specified filter criteria. Click Clear if you want to remove the current search and view all the event records.
8 Managing the HP XP7 Performance Advisor database This chapter discusses the following topics: • “Introduction” (page 141) • “Configuring database size” (page 143) • “Purging data” (page 146) • “Creating and viewing Export DB CSV files” (page 149) • “Archiving data” (page 160) • “Importing data” (page 163) • “Deleting logs for archival and import activities” (page 166) Introduction HP XP7 Performance Advisor uses Oracle as its database.
IMPORTANT: • You have to log on to HP XP7 Performance Advisor as an Administrator or a user with administrator privileges to configure, purge, archive, or import the HP XP7 Performance Advisor database. You also need this privilege to view or delete Export DB schedules. • Database related tools or functionalities should be executed with the same privilege that is used to install HP XP7 Performance Advisor. If you are trying to execute the tools, ensure that you are a member of the ORA_DBA Windows group.
• “Creating and viewing Export DB CSV files” (page 149) • “Archiving data” (page 160) • “Importing data” (page 163) • “Deleting logs for archival and import activities” (page 166) Configuring database size You can increase the HP XP7 Performance Advisor database size based on the disk space available on the management station, where HP XP7 Performance Advisor is installed.
Simultaneously, the following prediction on the time taken for the database to grow to the specified size is also displayed on the DBConfiguration/Purge screen:Given current data storage rates, DB grow in less than X hours. • If the available disk space is less than 3 GB or lesser than the configured Database size , the Auto Grow check box is automatically disabled, and the following message is displayed on the Event log screen:There is not enough space for the DB to autogrow; AutoGrow option is disabled.
Manually increasing database size IMPORTANT: • Before allocating the disk space, verify the available disk space. Disk Space available on drive where Database exists under DB Configuration/Purge displays the available disk space. • The Auto Grow option is selected by default under DB Configuration/Purge. In addition to increasing the database size by the number you specify, HP XP7 Performance Advisor also monitors the database size.
• “Deleting logs for archival and import activities” (page 166) • “Migrating data to another management station” (page 166) Purging data You can manually purge configuration and performance data for an XP or an XP7 disk array, or data older than the current specified date. HP XP7 Performance Advisor can automatically purge data. For more information, see “Automatically purging data” (page 147).
Click Cancel if you want to retain the records. Purging older data To purge data older than the specified date from the HP XP7 Performance Advisor database: 1. Click PA and DB Settings+Database Manager in the left pane. The Database Manager screen appears. By default, the DB Configuration/Purge is enabled. 2. 3. In the Purge section, select All data older than. Select the date using the calendar and the time from the Hour, Minute, and Seconds lists.
operations. If you enter an invalid value, then by default, the minimum threshold value is considered as 70. ◦ If you have selected the Auto Grow check box and specified the minimum threshold value as 70, the database size increases by 2 GB when the 70% threshold limit is reached. ◦ If you have cleared the Auto Grow check box and specified the minimum threshold value as 70, auto purge is triggered when the 70% threshold limit is reached.
The following table describes the alert messages related to the Delete and Shrink operations that are logged on the Event log screen: Alert Title Alert Description Database size is reaching threshold Current database size limit is approaching the minimum value(X%). The older data will be deleted threshold value. in a timely manner on reaching the threshold. Approximately data beyond X(date) cannot be accessed Delete operation is in progress Delete operation is in progress.
MP blade. You can export data from the .csv files to a data visualization program, such as Microsoft Excel. For more information about the generated .csv files, see “Export DB CSV files” (page 150). The .csv files are created when you export data for a specified duration or schedule it as a daily, weekly, or monthly activity. The .csv files are stored in the following location on the management station: \HPSS\pa\tomcat\webapps\pa\reports.
• The LUSE master ID (M), if an LDEV is configured as an LUSE Master. • The associated E-Port list, which is a list of Ext-Lun initiator ports that are used to connect E-Port(s) to an external array. • The associated E-Seq, which is the Ext-Lun provider's serial number for the E-seq(s) array. • The associated E-LDEV, which is the external LUN LDEV ID on the external array. • The associated CLPR group ID.
• The type of the port, such as the Fibre (Target), Fibre (Cont Acc Target), Fibre (Cont Acc Initiator), or the Fibre (Ext-Lun Initiator). • The associated E-Seq, which is the Ext-Lun provider's serial number for the E-seq(s) array. clpr_exportDB-array_serial_number_.csv This file includes the following details: • The XP/XP7 disk array serial number for which the report is generated. • The CLPR IDs on the XP/XP7 disk array. • The performance data collection interval time stamps.
jnl_exportDB-array_serial_number_.csv This file includes the following details: • The XP/XP7 disk array serial number for which the report is generated. • The journal group IDs on the XP/XP7 disk array. • The performance data collection interval time stamps. • The MU indicates the mirror unit number. • The CTG indicates the consistency group Id. • The JNLS indicates the journal pool status. • The AP indicates the number of active paths.
3. Based on your requirement, select the Collection Period as One Time or Recurring. • If you select the Collection Period as One Time, proceed to step 4.
◦ Collection Schedule: Displays Daily, Weekly, and Monthly. Collection Schedule Description Weekly By default, Weekly is selected as the collection schedule. The corresponding Day of the Week list displays the week days. If you want to configure a weekly schedule: – Select the week day when you want the schedule to be executed. – Select the time (hour : mins) when you want the schedule to be executed, from the Start Time lists. – Specify the number of times the schedule should repeat, in the No.
4. 5. 6. 7. Provide a name in the File Name box. The name must have a minimum of two characters and can have a maximum of 80 characters. HP XP7 Performance Advisor appends the name that you provide to the file names of all the .csv files that it generates. From the Array list, select the XP/XP7 disk array for which you want to save or schedule the Export DB report. Select the check box for Human Readable Format, if you want to view the data for LDEVs in the cu:ldev format.
10. Select the check box for Display LDEV's of the Journal, if you want to view all the LDEVs that belong to a journal pool. 11. Select the Start Time and End Time, if it is a one-time export activity. If you are scheduling the export activity, select only the start time. 12. If you are scheduling the export activity, retain the recipient email address displayed in the Email box or specify an email address where you want to receive the notifications. If you are saving the export DB report, the .
• “Importing data” (page 163) • “Deleting logs for archival and import activities” (page 166) • “Migrating data to another management station” (page 166) • “Generating, saving, or scheduling reports” (page 298) Importing data to MS Excel To import data into an Excel sheet: 1. Open the export DB file in MS Excel from the location where it is saved (\HPSS\pa\tomcat\ webapps\pa\reports). The Text Import wizard appears. 2. 3. 4. 5. 6. 7.
IMPORTANT: • The name of the user who created the report is displayed under User Name. If you logged in to HP XP7 Performance Advisor as an Administrator and created the Export DB report, the user name is displayed as Administrator. • The .csv records for which an asterisk (*) is displayed before the User Name indicates that they are generated through a schedule. The naming convention for the .
• “Migrating data to another management station” (page 166) • “Generating, saving, or scheduling reports” (page 298) Deleting Export DB reports and schedules IMPORTANT: You can delete a schedule record in the Scheduled Export DB tasks section, only if you have logged in to HP XP7 Performance Advisor as an Administrator or a user with administrator privileges. To delete an Export DB report or the corresponding schedule: 1. Click PA and DB Settings+Database Manager. 2.
IMPORTANT: • After the data is archived, it is permanently deleted from the HP XP7 Performance Advisor database and the free disk space is released back to the database. If you want to use the archived data for an XP or an XP7 disk array, import the corresponding .dmp files. Before importing data to XP or XP7 disk array on the management station, ensure configuration collection is performed for a particular array, or perform a fresh configuration data collection..
5. Click Export. HP XP7 Performance Advisor archives data for the specified duration. As part of the archival process, HP XP7 Performance Advisor does the following: a. Displays an informational message that the export for the selected array is successfully initiated and starts exporting the data. b. Logs two records under Export data for the date and time when the archival is complete. c. Creates two .dmp files and displays their names under File Name.
Importing data You can import the archived data to another management station or back to the same management station from where the data was initially exported. CAUTION: • You must import the data to the same version of the management station as that of the installed HP XP7 Performance Advisor. For example: If you have installed HP XP7 Performance Advisor v6.0, then you must import the data to management station version 6.0.
IMPORTANT: • The following are a few important points: After importing performance data for an XP or an XP7 disk array, ensure that you perform a fresh configuration data collection for that XP/XP7 disk array on the target management station, as the archival process only exports the performance data.
NOTE: 4. translates to %PADB_HOME% in this context of importing data. Click Import. Based on whether the import is for an XP or an XP7 disk array, HP XP7 Performance Advisor does the following: a. Displays an informational message that the import for the selected XP/XP7 disk array is successfully initiated. b. Imports performance data from the .
Deleting logs for archival and import activities IMPORTANT: These records are logged under Export Data and Import Data respectively, and are not displayed on the Event Log screen. To delete the records logged as part of the export and import activities: 1. Click PA and DB Settings+Database Manager in the left pane. 2. On the Database Manager screen, click the Archive Export/Archive Import tab. 3.
Where, refers to the XP/XP7 disk array for which the data is exported. Time Select this option to migrate the configuration and performance data from the HP XP7 Performance Advisor database for a duration that you want. Enter the duration (format – DD-MM-YYYY) in the Start Date and End Date boxes. The data available for all the XP and the XP7 disk arrays during the specified duration is backed up into the following .dmp files: • PA_Exp.
1. 2. 3. Click Start > Programs > HP XP7 Performance Advisor > Backup Utility. The Backup Utility window appears displaying the following options: • DKC • Time • All Based on your requirement, select one of the following options: • DKC: Provide the 5 digit serial number of the XP/XP7 disk array, for which you want to take the data backup • Time: Provide the duration for which you want to take data backup in the DD-MM-YYYY format.
Saving or restoring data from the Windows command line To save or restore your data from the Windows command line: • To save your files, enter: %HPSS_HOME%\bin\backuputility -backup target-path Where, target-path is the location, such as a network drive or shared file system where you want to save the backup files. You can also backup data for an XP or an XP7 disk array DKC or a particular duration.
Determining disk space requirements Use the following formula to determine the disk space requirements for HP XP7 Performance Advisor on a day basis.
Example 1 Determining the disk space requirements for HP XP7 Performance Advisor Consider that the XP7 and the XP disk arrays, P9500 and XP24000 are monitored by the HP XP7 Performance Advisor management station. • P9500 Disk Array details: ◦ LDEVs = 1703 ◦ PORTs = 96 ◦ Dkc_Collection_frequency = 300 seconds (5 * 60) ◦ Ldev_Collection_frequency = 600 seconds (10 * 60) ◦ Port_Collection_frequency = 600 seconds (10 * 60) Free_Space on P9500 Disk Array = [(86400/600) *1703 * 0 .
9 Viewing XP and XP7 disk array components This chapter discusses the following topics: • “Introduction” (page 172) • “Viewing performance summary” (page 177) • “Viewing XP and XP7 disk array summary” (page 181) • “Volume Information” (page 182) • “Advisory on CLPR utilization” (page 185) • “Viewing CHIP/CHA data” (page 185) • “Viewing ACP/DKA data” (page 189) • “Viewing MP blade utilization for P9500/XP7 disk arrays” (page 193) • “Viewing Smart and ThP pools data for P9500/XP7 disk arrays”
1. Click Monitoring+Array View in the left pane. All the XP and the XP7 disk arrays monitored by HP XP7 Performance Advisor are grouped under Arrays. Custom groups, if configured are grouped under Custom Groups. 2. To view the performance, summary, and utilization of an XP or XP7 disk array, click the plus (+) sign for Arrays and select the disk array in the component selection tree.
Figure 13 Array View screen ??? shows the Array View screen for 10035, which belongs to the XP7 disk array type: Further, to view the performance and utilization metrics at the component level in the disk array, click the plus (+) sign for the disk array and select the component node from the list displayed. Click each component under a particular component node to view the individual performance or utilization data.
Table 10 Array View component nodes (continued) Component selection tree Description Documentation Links For XP disk arrays For P9500/XP7 disk arrays “Viewing LDEV data” (page 214) Yes Yes FrontendIO Provides the list of “10 busiest Yes busiest frontend LDEVs LDEVs/Ports” (page 208) and the ports associated with the LDEVs Yes BackendIO Provides the list of “10 busiest LDEVs/RAID Yes busiest backend LDEVs groups” (page 209) and the ports associated with the LDEVs Yes RG Summary Provides the fol
Table 10 Array View component nodes (continued) Component selection tree Description Documentation Links For XP disk arrays For P9500/XP7 disk arrays Port Summary “Port summary” (page 212) Yes Yes Provides the following “Viewing MP blade No details for an MP blade: utilization for • Average utilization of P9500/XP7 disk arrays” the MP blade, which (page 193) Yes Provides the following details for a port: • Performance summary for all the related metrics • Current configuration, which includes the
Table 10 Array View component nodes (continued) Component selection tree Description Documentation Links CHA/DKA • “Viewing CHIP/CHA No data” (page 185) Provides the following details for the installed CHA and the DKA: • Average performance derived from the overall average performance of all the ports in the CHIP or the RAID groups in the DKA For XP disk arrays For P9500/XP7 disk arrays Yes • “Viewing ACP/DKA data” (page 189) • Average performance of individual ports for a CHA • Average performance
The following table describes the Performance View screen elements. The images shown are for 53036, which belongs to the P9500 Disk Array type.
Performance View screen elements Description CHIP Port Activity Ave group box Displays the I/Os, MB/s, and the associated port IDs for all those CHIPs/CHAs that are processing requests. The port type, such as FCoE (applicable only for P9500/XP7 disk arrays) is also displayed beside the port ID. For an XP7 disk array, the CHAs are grouped based on the clusters to which they belong. For more information, see “Viewing CHIP/CHA data” (page 185).
Performance View screen elements Description DKA_2, and ThP_Pool_2 is served by only DKA_1. If the combined backend transfers on ThP_Pool_1 is 50 I/Os, and ThP_Pool_2 is 30 I/Os, the combined backend transfers of DKA_1 is 80 I/Os (sum of the backend transfers on ThP_Pool_1 and ThP_Pool_2), and DKA_2 is 50 I/Os (sum of the backend transfers on ThP_Pool_1).
IMPORTANT: • The MIX CHIP displays only eight ports and four MPs though there are eight MPs on that board. The remaining four behave as ACP MPs. Viewing XP and XP7 disk array summary The summary for the selected XP/XP7 disk array is displayed under the Summary View tab. Initially, before you begin configuration collection, only the information related to the XP/XP7 volumes presented to the host are displayed on the Array View screen.
Volume Information The following table provides a summary of all the components for the selected XP/XP7 disk array. Physical LDEVs The total number of LDEVs created from RAID groups. Ports The total number of Ports available from the installed CHAs. LUNs The number of LDEVs that have one or more associated paths (host connectivity). This is an aggregate of the following: Physical LDEVs with paths plus the virtual volumes with paths plus the total number of LDEVs in LUSE that has an associated path.
Viewing utilization summary The utilization summary is displayed for the selected XP/XP7 disk array when you click the Utilization Summary tab. The following image shows the utilization summary for 53036, which belongs to the P9500 Disk Array type. Figure 14 Utilization Summary The utilization summary provides the following details about the XP/XP7 disk arrays: serial number, model, firmware version, and the date and time stamp of the last DKC performance data collection.
• MP blade utilization, which includes the following: ◦ MP blade IDs. ◦ DKCs, cluster #, and the blade locations for the MP blades. ◦ The MPs on the MP blade and each MP's utilization percentage. Click an MP to view the corresponding utilization percentage graph in the Chart Work Area. By default, the data displayed is for the last one hour. • CHIP data, which includes the following: ◦ DKCs, cluster #, and the slots where the CHAs are located.
Advisory on CLPR utilization HP XP7 Performance Advisor provides an advisory on the usage of individual CLPRs in an XP or an XP7 disk array. The advisory is based on the data collected for the past one week. The following are the scenarios for which an advisory is created: • If the cache for a CLPR is less utilized, the advisory suggests that you consider re-allocating portion of the cache to the other CLPRs.
The summary is displayed in the CHIP/CHA summary table for the XP disk arrays and the CHA summary table for the XP7 disk arrays (see following images). • The CHIP/CHA summary table includes the performance and utilization metrics of all the installed CHIPs/CHAs • The CHA summary table includes only the performance metrics of all the installed CHAs Further, you can also click an individual CHIP/CHA in one of the above-mentioned tables to view its metrics.
The following table describes the CHIP/CHA summary table for an XP disk array and the CHA summary table for an P9500/XP7 disk array. CHIP/CHA summary table for XP disk arrays includes... CHA summary table for P9500/XP7 disk arrays includes... The CHIP or the CHA name The CHA name Example: CHA-1EU Example: CHA-1F, 1 indicates the cluster # where the CHA board is located.
IMPORTANT: • The port type, such as FCoE (applicable for P9500/XP7 disk arrays) is also displayed beside the port ID. • Since, the CHIP/CHA and the ACP/DKA MPs are moved to the MP blades in the P9500 and XP7 disk arrays, their MP utilization metrics are not applicable for the P9500 and XP7 disk arrays. For more information, see “Viewing MP blade utilization for P9500/XP7 disk arrays” (page 193).
The individual performance data for CHA-1EU includes the following: • • Summary: ◦ Fibre protocol is used ◦ Eight ports are associated with CHA-1EU ◦ Port Activity Avg shows average I/Os as 10409.17, which is an average of the overall average I/Os on all the eight ports. It also displays the average MB/s as 81.33, which is the an average of the overall average MB/s on all the eight ports.
Further, you can also click an individual ACP/DKA pair in one of the above-mentioned tables to view its metrics. For more information, see “Viewing summary of an individual CHIP/CHA” (page 188).
The following table describes the ACP/DKA summary table for an XP disk array and the DKA summary table for an XP7 disk array. ACP/DKA summary table for XP disk arrays includes... DKA summary table for P9500/XP7 disk arrays includes... The ACP/DKA pair name The DKA pair name Example: BUNU Example: AUMU The individual MPs on an ACP/DKA and the utilization percentage of each MP Not applicable In the above image, BU MP Utilization % indicates the utilization of the MPs on BU, which is the left ACP.
In addition, the combined backend transfer value is displayed for each ACP or DKA (applicable for XP24000, P9500/XP7 disk arrays). For more information, see the description provided for ACP Pair Backend group box in “Viewing performance summary” (page 177). Viewing summary of an individual ACP/DKA Click an individual ACP/DKA in either the DKA summary table or the ACP/DKA summary table to view its data.
Related Topics • “Viewing performance summary” (page 177) • “Viewing ACP/DKA data” (page 189) • “Viewing MP blade utilization for P9500/XP7 disk arrays” (page 193) • “Viewing Smart and ThP pools data for P9500/XP7 disk arrays” (page 197) • “Utilization Summary” (page 183) • “10 busiest LDEVs/Ports” (page 208) • “10 busiest LDEVs/RAID groups” (page 209) • “Port summary” (page 212) • “Viewing LDEV data” (page 214) Viewing MP blade utilization for XP7 disk arrays Click an MP blade ID in the M
On the following MP Blades screen, you must click an MP blade ID in the MP Blade Configuration group box (see “MP Blades screen” (page 194)) to view the above-mentioned list. In the following image, the MP Blade Summary , Processing Distribution , and the Top Components are displayed for MPB-1MA. For more information, see “MP blade utilization summary” (page 194).
Table 11 MP blade utilization summary (continued) MP blade screen elements Description can be LDEVs, external volumes, and the continuous access journal groups. The total of the above-mentioned constitutes the total number of consumers for the selected MP blade. Processing Distribution table Displays the following details: • Processing Type: The list of processing types. • Avg. Util%: The average MP blade utilization by each processing type.
The MPB-1MB utilization data includes the following: • MPB-1MB is the MP blade ID that was selected in the MP Blades Util% group box. MPB-1MB is also listed in the MP Blade Configuration group box. • MPB-1MB belongs to the Cluster 1 and the DKC 0. • 1 in MPB-1MB represents the cluster # and MA represents the blade location for MPB-1MB. • MP 0, MP 1, MP 2, and MP 3 are the MPs on MPB-1MB. • The average utilization of MPB-1MB is 2%.
Related Topics • “Viewing performance summary” (page 177) • “Viewing ACP/DKA data” (page 189) • “Viewing Smart and ThP pools data for P9500/XP7 disk arrays” (page 197) • “Utilization Summary” (page 183) • “10 busiest LDEVs/Ports” (page 208) • “10 busiest LDEVs/RAID groups” (page 209) • “Port summary” (page 212) • “Viewing LDEV data” (page 214) Viewing Smart and ThP pools data for P9500/XP7 disk arrays HP XP7 Performance Advisor provides the current configuration and performance data for the
Figure 17 THP Pool Screen IMPORTANT: The data on the Smart pools and the ThP pools are not displayed if the pools are not configured in the selected P9500 and XP7 disk array. The following error message is displayed: Smart and ThP pools are not configured for this P9500/XP7 Disk Array.
Table 13 Smart Pool monitoring information table Label name Description Last available start time Displays last available monitoring cycle start time with PADB. Last available end time Displays last available monitoring cycle end time with PADB. Relocation Type Displays type of tier relocation. For example, Auto or Manual. Monitoring Mode Displays mode of monitoring. For example, Period or Continuous. Monitoring Status Displays status of a monitoring cycle. For example, Monitoring or Stop.
Table 14 Pool Information table (continued) Column names Description Average Read Response Time Displays the average of Average Read Response time of the Pool Virtual Volumes. Average Write Response Time Displays the average of Average Write Response time of the Pool Virtual Volumes. Tier Relocation Progress Rate Displays the rate at which the relocation is performed at the end of each monitoring cycle. The value displayed is in the range of 0 to 100. • Displays 0, if no relocation is performed.
Select a VVol or a RAID group record, and click Plot Chart to view the performance graphs for the above-mentioned metrics. Configuring VVol settings You can configure the following VVol settings: • The maximum number of VVol records you want to view. NOTE: HP recommends viewing a maximum of 150 records at a time, so that there is no performance impact. • The metrics based on which you want to sort the records.
To understand how different tiers are utilized by a Smart pool, compare the utilization of individual RAID groups that constitute the Smart pool. You can see the utilization of individual RAID groups and also the overall utilization of all the RAID groups. You must determine the drive types of the individual Raid groups that constitute the Smart pool. Also, you need to know the RAID group for which you want to determine the drive type. The RAID groups are listed under Pool Volumes in the Pool Details table.
Figure 19 Continuous Access Sync Figure 20 Continuous Access Async Table 16 (page 203) describes the data displayed: Table 16 Continuous access configuration data Screen element Description Primary Array Serial number of the primary XP or XP7 disk array (primary data center). PVOL LDEV configured as P-VOL on the primary data center. Displays the LDEV number in cu:ldev format. Secondary Array Serial number of the secondary XP or XP7 disk array.
Table 16 Continuous access configuration data (continued) Screen element Description • Reverse Copy • Pair SideFile 30% over • Pair SideFile over Suspend • SVOL Swap ready Suspend • Unknown Volume Type Type of volume (PVOL or SVOL) configured on the primary data center. Provision Type Thick or Thin, indicates virtual volume or physical LDEV. CA Link Status Failed or Active.
Table 16 Continuous access configuration data (continued) Screen element Description RG RAID group to which volume type (P-VOL or S-VOL) the LDEV belongs. RAID Level RAID classification for the RAID group is determined based on the associated volume type (P-VOL or S-VOL). CA link status metrics Select the row to see the performance metrics of PVOL or SVOL (based on the volume type). If journals are displayed in the selected row, the journal group and volume details are also displayed.
Table 18 CA volume performance data (continued) Screen elements Description Write Pending % The percentage of data pending to be written on an LDEV from the CLPR that is configured for the selected Volume type (S-VOL or P-VOL). Side File % The utilization of the side file shown as a percentage for a CLPR that is configured for the selected volume based on the volume type (S-VOL or P-VOL).
Table 20 CA journal (continued) Screen element Description Usage (%) The % utilization of the journal group. Qmarker Latest sequence # for writing to the PVOLs consistency group at the PAIR state. Qcnt Number of remaining Q-Markers within the journal data. PVOL Average Write IOPS Average write I/O per second of the PVOL based on the selected journal ID. PVOL Write IOPS Total write I/O per second of the PVOL based on the selected journal ID.
Viewing 10 busiest LDEVs and Ports To view the 10 busiest LDEVs or ports associated with an XP or an XP7 disk array's frontend activities, click FrontEndIO in the component selection tree for the XP/XP7 disk array. The top 10 busiest LDEVs are displayed under the LDEV tab and the top 10 busiest ports are displayed under the Ports tab. This data is also displayed when you click the Frontend Total Avg group box under the Performance View tab.
Related Topics • “Viewing performance summary” (page 177) • “Viewing CHIP/CHA data” (page 185) • “Viewing ACP/DKA data” (page 189) • “Utilization Summary” (page 183) • “10 busiest LDEVs/RAID groups” (page 209) • “RAID Group summary” (page 210) • “Port summary” (page 212) • “Viewing LDEV data” (page 214) Viewing 10 busiest LDEVs and RAID groups To view the 10 busiest LDEVs and RAID groups associated with an XP or an XP7 disk array's backend activities, click BackEndIO in the component selecti
Figure 24 10 busiest backend RAID groups Related Topics • “Viewing performance summary” (page 177) • “Viewing CHIP/CHA data” (page 185) • “Viewing ACP/DKA data” (page 189) • “Utilization Summary” (page 183) • “10 busiest LDEVs/Ports” (page 208) • “RAID Group summary” (page 210) • “Port summary” (page 212) • “Viewing LDEV data” (page 214) Viewing RAID group summary To view the summary of overall utilization of RAID groups for an XP or an XP7 disk array, click RG Summary in the component sele
Figure 25 RAID Group summary Screen elements Description RG The RAID group to which the LDEV belongs. SLPR The SLPR with which the RAID group is associated. NOTE: SLPR does not exist in the P9500/XP7 disk arrays. So, the SLPR-related data is displayed only for the XP disk arrays. SLPR Name The SLPR group ID. NOTE: SLPR does not exist in the P9500/XP7 disk arrays. So, the SLPR group ID is displayed only for the XP disk arrays. CLPR The CLPR with which the RAID group is associated.
Screen elements Description % RGUtil SeqWrite The sequential write utilization percentage for a RAID group. % RGUtil Seq Write Parity The sequential write parity utilization percentage for a RAID group. Overall % RGUTIL The overall percentage utilization of a RAID group, which is the sum of the random reads, random writes, random write parity, sequential reads, sequential writes, and the sequential write parity.
Screen elements Description SLPR Name Displays the SLPR group ID. NOTE: SLPR does not exist in the P9500/XP7 disk arrays. So, the SLPR group ID is displayed only for the XP disk arrays. Port Type Displays the port type, such as FCoE (applicable for P9500/XP7 disk arrays) for the port ID. E-seq(s) Displays the Ext-Lun provider's serial number for the array. Max IO/s Displays the maximum frontend I/Os on the port. Avg IO/s Displays the average of the total frontend I/Os.
Viewing LDEV data HP XP7 Performance Advisor displays the following data on the Array View LDEV screen for all the LDEVs that belong to an XP or an XP7 disk array: • The performance data of all the LDEVs • The data on associated components, such as the following: ◦ ◦ The summary for individual RAID groups, which includes: – RAID level – Associated ACP pair – Disk mech details – Associated drive type and RPM rate The I/Os and MB/s data for individual CHIP ports For an XP disk array, in additio
By default, the values displayed for the following are based on the performance values of all the LDEVs that are displayed for the last collection time stamp: • Total IOs: The total frontend I/Os handled by the selected XP or XP7 disk array. • Total MBs: The total frontend throughput in MB/s managed by the selected XP or XP7 disk array. • Total Tracks: The total tracks on the selected XP or XP7 disk array.
NOTE: The data for the following metrics sorts in the ascending order: • Host Group • Chip Port ID • ACP Pair ID • LDEV ID • Emulation • Cont. Access. The remaining metrics sorts in the descending order. “Array View LDEV table - Sort By options” (page 216) describes the sorting options based on which you can sort the data in the LDEV table.
Table 22 Array View LDEV table - Sort By options (continued) Screen elements Description • Sequential reads • Sequential writes LUSE Select LUSE to sort LDEV data based on the LUSE information, which indicates if an LDEV is also an LUSE (LUN Size Expansion (Luse).E = Master C = Component). LDEV ID Select LDEV ID to sort LDEV data based on their cu:ldev IDs. RG(s) Select RAID Groups to sort LDEV data based on the associated RAID groups.
3. Sort the LDEV data based on one of the options displayed in the Sort By list. By default, the LDEV data is sorted based on the average read response and displayed in a descending order in the LDEV table. For more information on the attributes, see “Array View LDEV table - Sort By options” (page 216). Before clicking the Query button, you can also select the attribute from the Sort By list. The LDEV data is automatically sorted based on the selected attribute and displayed in the LDEV table.
2. Select the check box for the component that must be monitored. Choose the Select All check box, if you want to choose all components and add them as columns of information to the LDEV table. 3. Click Update Columns. Clear the Column Settings check box to close the LDEV Column Settings list. Accordingly, new columns are added and the data for the selected components is displayed under the respective new columns in the LDEV table.
Table 23 Components and metrics in LDEV Column Settings list (continued) Screen elements Description Backend Transfer Sequential Reads The backend transfer sequential reads for the LDEV. Backend Transfer Non-Sequential Reads The backend transfer non-sequential reads for the LDEV. Backend Transfer Writes The backend transfer writes for the LDEV. Emulation An array group is divided into open volumes of equal size. These volumes are referred to as emulation types.
Table 23 Components and metrics in LDEV Column Settings list (continued) Screen elements Description Luse Master The LDEV ID of the Luse master when the LDEV is a component. If the LDEV is not a Luse component, this field is blank. LUN (Logical Unit Number) ID The identification number of the LUN. MP Blade Id The identification number of the MP blade that is currently processing requests for an LDEV. The MP blade ID includes the cluster # and the blade location.
NOTE: • The E-LDEV, Ext-LUN, E-Port(s), E-Seq, Jnl Group, and Vol. Group are available for selection only if they are configured in the selected XP or XP7 disk array. • The following metrics are not applicable for the XP or the XP7 continuous access journal pool LDEVs.
The following are the different replication pair statuses: Replication pair statuses Description SMPLex Volume is not configured for replication activity. COPY Volume is in the Copy mode, where data from the P-Vol is being copied to the S-Vol. PAIRED Volumes are configured for replication activity. Pair Suspend The replication pair volumes are suspended mode. Pair Suspend Error The replication pair volumes are suspended, as an error is noticed with the pair.
1. Click the RG list. 2. In the RAID Group filter that appears, select the check box for those RAID groups, for which you want to view the corresponding LDEV data. Click OK. 3. The LDEV table displays only those records that match the specified RAID group IDs.
Exporting LDEV data You can export LDEV data to an Excel spreadsheet for the date and time range that you specify. The data for all the LDEVs monitored by HP XP7 Performance Advisor during the specified start and end date, and time are exported to a spreadsheet in a CSV format. To export the LDEV data: 1. Select the date range from the Start Date and End Date calendars. 2. Select the time range from the respective hour : minutes : seconds lists. 3. Click Export to Excel.
table indicates the hierarchical information of the selected RAID group. For more information on view CLPR information, see “CLPR detail view” (page 228). Continuous Access Journal Detail View Double-click a Journal group volume ID in the Jnl Group column to open the Continuous Access Journal Detail View screen, as shown in Journal Group detail view. A list of LDEVs configured in the continuous access journal volume displays; a maximum of 16 LDEVs display.
RAIDGroup in the LDEV table. Click a THP-PID() to view the ThP pool occupancy information, which includes the mapping between the pool volumes (real LDEVs) and the V-VOLs. Screen elements Description THP Pool ID The ID of the pool (pool number) THP Pool Status The status of the ThP Pool • 0: Undefined/Creating/Deleting – Specified pool does not exist completely.
Viewing SLPR information IMPORTANT: • SLPR does not exist in P9500/XP7 disk array. Click a SLPR value in the LDEV table to view the detail view for that SLPR in a separate browser window. In the SLPR window, the line above the table indicates the hierarchical information of the selected SLPR. The SLPR view includes two tabs, the CLPR tab and the Ports tab.
2. Click the plus (+) sign for Custom Group and then select an individual custom group from the list. The LDEVs that belong to the selected custom group are displayed in the LDEV table. The filtering of data is restricted to only those LDEV records that are included in the selected custom group. For more information on using the LDEV filters and adding or removing columns, see Viewing LDEV data. For more information on custom groups, see “Creating custom groups” (page 84).
10 Using charts This chapter discusses the following topics: • “Introduction” (page 230) • “Plotting charts” (page 234) Introduction You can plot performance graphs to view historical data of components that belong to the same or different XP disk arrays and XP7 disk arrays. Graphical representation of components performance metrics is especially useful when you want to compare similar components of different XP and XP7 disk arrays to determine their performance and observe trends.
Figure 28 Charts screen 1 Charts controls 2 Component selection tree for charts 3 Available Metrics Choose Metric Category list from where you select metrics for components 4 Chart settings 5 Zoom preview panel 6 Chart window (blue border indicates that the chart window is selected or active) Click the black Up arrow positioned at the top right corner of the Data Source and Chart Settings sections to collapse those sections. Click the black Down arrow to restore the sections.
Sections Description ◦ Snapshot Pool ◦ Pools ◦ Replication Volumes ◦ LUSE ◦ Host Groups ◦ Ext-RG(s) ◦ Drive Types In addition to the above listed, the MP Blades category is also displayed for the P9500/XP7 disk arrays. • Custom groups The custom groups that you created appear. When you click a custom group, all the LDEVs that belong to the custom group are displayed for your selection. For more information on creating custom groups, see “Creating custom groups” (page 84).
Sections Description Chart Work Area The Chart Work Area consists of the following: • The individual chart windows that display the performance graphs of components for the selected metrics. • The chart controls that can be used to perform various tasks on the individual chart windows. • The zoom preview panel, where you can preview performance of components for a specified duration. For more information, see “Viewing charts” (page 269).
Plotting charts NOTE: The figures in the following procedure are an example for the XP disk array metric selection. Prerequisite Ensure that the following prerequisites are met before you navigate to the Charts screen: • You have collected the performance data, so that the data on associated components is displayed under the various categories for the individual XP and XP7 disk arrays. • The custom groups are created, so that they appear for selection under Custom Groups in the component selection tree.
LDEV in the component selection tree, if you are aware of the LDEV name. For more information, see “Searching for components” (page 266): • Click the plus (+) sign for an XP or an XP7 disk array and select components from the list, for which you want to view the performance graphs. The following image displays the hierarchy for component selection. For more information on selecting components, see “Selecting components and metrics” (page 236).
3. Choose the metrics for which you want to view the performance of the selected components. For more information, see “Choosing metrics” (page 238). By default, the most used metric category and related category metrics are listed. A performance graph for the selected component and metric is automatically displayed in the Chart Work Area. 4.
XP or XP7 Disk Array main categories – component selection tree Description MP Blades Comprises of individual MP blades and the associated processors. For more information, see “MP Blades navigation path” (page 243). NOTE: The MP Blades category is applicable only for the P9500/XP7 disk arrays. Back-end For an XP disk array, Back-end comprises of the backend components, such as the DKA pairs, associated MPs, and the RAID groups.
XP or XP7 Disk Array main categories – component selection tree Description Ext-RG(s) Comprises of the external RAID groups that are managed by the XP and XP7 disk arrays. For more information, see “Ext-RG(s) navigation path” (page 261). Drive Types Comprises of the individual drive types that are available on the selected XP and XP7 disk arrays. Also, includes the RAID groups for each of the drive types. The RAID groups further display the list of associated physical LDEVs.
performance graph in the Chart Work Area. You can also click the Metric check box to view performance graphs for all the metrics listed. The related metrics are displayed in the Available Metrics Choose Metric Category list, if you select a homogeneous set of components, where the selected components belong to the same component type within or across the XP and the XP7 disk arrays. The related metrics can belong to different metric categories.
In the above image, under Front-end for the XP disk array 10090 (XPArray_1): 1. Front-end is the main category. 2. Port is the component type. The number (40) indicates the number of ports for the XP disk array 10090. 3. CL1A is one of the individual ports. 4. CHP00–1EU is an individual MP associated with the port CL1A. 5. CHA–1EU is an individual CHA associated with the selected CHP00–1EU. For the XP7 disk arrays The Front-end main category comprises of the ports that further displays the associated CHAs.
under For the XP disk arrays and For the XP7 disk arrays columns indicate whether the particular default metric is applicable for that XP or P9500/XP7 disk array.
In the above image, under Cache for the XP disk array 10055: • Cache is the main category. The number (6) indicates the number of CLPRs partitions configured on the selected XP disk array. • The CLPR0 and CLPR1 are the individual CLPRs. The applicable metrics are displayed in the Available Metrics Choose Metric Category list. Select the metrics at the component type or the individual component levels, or both to view the related performance graphs in the Chart Work Area.
MP Blades navigation path IMPORTANT: This section is applicable for the P9500 and XP7 disk arrays. The MP Blades main category comprises the individual MP blades for an P9500/XP7 disk array. Each MP blade is identified by the cluster # and the blade location, and further displays the list of processors. Following is the component selection path: MP Blades > Individual MP Blade (ID, cluster #, blade location) > Processors (component type) > Individual processor IDs.
In addition to viewing the utilization metrics for an MP blade and its individual processors, you can also view the following: • The top 20 consumers of an MP blade, see “Viewing top 20 consumers of an MP blade” (page 273) • The MP blade utilization split up for each processing type, see “Viewing MP blade utilization by processing types” (page 274) • The LDEV that is currently assigned to an MP blade, see “Viewing current LDEV assignments for an MP blade” (page 283) Related Topics • “Front-end naviga
In the above image, under Back-end for the XP disk array 10090: • • DKA is a component type. The number (2) indicates the number of DKA pairs available on the selected XP disk array. ◦ AUMU is an individual DKA pair ◦ BUNU is an individual DKA pair RG(s) is a component type. The number (6) indicates the number of RAID groups configured on the selected XP disk array. 1–1 to 1–6 are individual RAID groups. The list under 1–1 displays the following component types: ◦ Physical LDEVs.
The Back-end main category comprises of the DKA pairs, RAID groups, and LDEVs, where DKA and RAID groups are the main component types that further expand to display the associated components. Following is the component selection path: • Back-end > DKA (component type) > Individual DKA pairs. • Back-end > RG(s) (component type) > Individual RAID Groups.
pool. The pool to which the physical LDEVs belong are also displayed beside the LDEV IDs. The ThP or the snapshot pool to which the physical LDEVs are assigned can also be traced under the respective Pools main category or the Snapshot Pool main category, where the corresponding ThP or snapshot pool IDs are displayed and list the of LDEVs assigned to these pools. For more information, see “Pools navigation path” (page 247) and “Snapshot Pool navigation path” (page 251).
Pools > Individual ThP pool IDs. Each individual ThP pool further includes the following: • DKA (component type) > Individual DKA pair associated with the selected ThP pool • LDEVs (component type) > Individual LDEVs > RG(s) (component type) > Individual RAID Groups assigned to the selected ThP pool • VVols (component type) > Individual host group > Volumes (component type) > Individual LDEVs associated with a host group The number of components associated with a component type is displayed beside it.
• LDEVs is a component types, and it lists the LDEVs associated with ThP Pool ID:126. LDEVs further expands to display the individual LDEVs and their Raid Groups associated with the ThP Pool ID:126. The Raid Groups are listed under RG(s) for each LDEV. • VVols is a component type. The volumes listed under VVols are grouped based on the host groups. The number (1) indicates the total number of VVols from the specified host group within the ThP Pool ID:126.
In the above image, under Pools for the P9500 disk array 53012: • Pools is the main category. • THP is the component type that displays the individual ThP pools. • SMART is another component type. • Pool ID:5 is a Smart pool. • RG(s) is a component type under Smart Pool ID:5 and lists the RAID groups that are associated with the Smart pool. RG(s) further expands to display the individual RAID groups and pool LDEVs associated with the Smart Pool ID:5.
the XP disk arrays and For the XP7 disk arrays columns indicate whether the particular default metric is applicable for that XP disk array.
In the above image, under Snapshot Pool for the XP disk array 10090: • Snapshot Pool is the main category. The number (1) indicates the number of snapshot pools configured on the XP disk array 10090. • Pool ID:25 is one of the individual snapshot pools. • LDEVs is a component type. The number (4) indicates the number of Ldevs associated with the Snapshot Pool ID:25. • ◦ 9:C9 is one of the individual LDEV. ◦ RG(s) is a component type.
The applicable metrics are displayed in the Available Metrics Choose Metric Category list. Select the metrics at the component type or the individual component levels, or both and view the related performance graphs in the Chart Work Area. For a description of these metrics, see “Metric Category, metrics, and descriptions” (page 386). The following table provides the default set of metric categories that are displayed in the Available Metrics Choose Metric Category list for the XP disk array.
In the above image, under Replication Volumes for the P9500 disk array 53036: • Business Copy Volumes is a component type. The number (15) indicates the number of LDEVs that are assigned as business copy volumes. Click Business Copy Volumes to view the list of LDEVs. • Continuous Access Volumes is a component type. The number (15) indicates the total number of journal pools that are created. ◦ JID-0:0 is a journal pool under which LDEVs is a component type.
Replication Volumes category for XP and XP7 disk arrays Most used default metric category NOTE: For Continuous Access Volumes, the following write metrics are disabled: • IO Metrics ◦ Total IO Writes — Frontend ◦ LDEV Random Writes — Frontend ◦ LDEV Sequential Writes — Frontend • MB Metrics ◦ Total MB Writes — Frontend ◦ Random MB Writes — Frontend ◦ Sequential MB Writes — Frontend • Utilization Metrics ◦ Average Write Response ◦ Maximum Write Response Related Topics • “Front-end navig
The number of components associated with a component type is displayed beside it. For example: • LUSE (21) • Components (2) In the above image, under LUSE for the XP disk array 10090: • LUSE is a main category. The number (21) indicates the number of LUSE masters available in the LUSE category. • 0:7B (1–1) is an LUSE master. 1–1 besides 0:7B indicates the RAID group to which the LUSE master belongs. • Components is a component type.
• “Pools navigation path” (page 247) • “Snapshot Pool navigation path” (page 251) • “Replication Volumes navigation path” (page 253) • “Host Groups navigation path” (page 257) • “Ext-RG(s) navigation path” (page 261) • “Drive types navigation path” (page 262) • “Custom groups navigation path” (page 265) Host Groups navigation path In HP XP7 Performance Advisor v6.
the associated LDEVs. The utilization shown is not specific to the host group to which the RAID group belongs. Each RAID group further displays the following: • ◦ Individual RAID group > Physical LDEVs (component type) > Individual physical LDEVs. ◦ Individual RAID group > Pool LDEVs (component type) > Individual pool LDEVs. Host Groups > Individual host groups > LDEVs (component type) > Individual LDEVs. At the individual LDEV level, you can view the corresponding average I/O per second data.
• RG(s) is a component type under Host Group. The number (1) beside RG(s) displays the number of RAID groups assigned for Host Group. • 1-7 is a RAID group associated with Host Group. The number 44 beside 1-7 indicates the average utilization of RAID group 1-7 by all the LDEVs from different host groups. ◦ Physical LDEVs is a component type under RAID group 1-7. The number 911 indicates the number of physical LDEVs in RAID group 1-7. ◦ Pool LDEVs is a component type under RAID group 1-7.
In the above image, under Host Groups for the XP disk array 10090: • Under the main category Host Groups, XPPA247_HYP_V_NEW_BLD_BAY6 is one the individual host group. The number 0 indicates the aggregate of the average I/Os from each LDEV belonging to Host Group • A:2E is a PVol under the LDEVs node. • S-Vol is a component type under PVol. The number 1 beside S-vol displays the number of Svols assigned to the PVol. A:1E is an Svol that is associated with the PVol A:2E.
For ports that are configured to communicate with the selected host groups, you can also view the associated MPs and CHAs for the XP disk arrays, and only the CHAs for the P9500/XP7 disk arrays under the Front-end category. For the LDEVs that are associated with the selected host groups, view their RAID groups under the Back-end category. For more information, see “Front-end navigation path” (page 239) and “Back-end navigation path” (page 244).
The available metrics are displayed in the Available Metrics Choose Metric Category list. Select the metrics at the component type or the individual component levels, or both and view the related performance graphs in the Chart Work Area. For a description of these metrics, see “Metric Category, metrics, and descriptions” (page 386). The following table provides the default set of metric categories that are displayed in the Available Metrics Choose Metric Category list for the XP and the XP7 disk arrays.
The number of components associated with a component type is displayed beside it. For example: • Drive Types (1) • RAID Groups (6) • Physical LDEVs (884) In the above image, under Drive Types for the P9500 disk array 53036: • Drive Types is the main category. The number (1) indicates the number of drive types available in that category. • DKS5B-K146SS is an individual drive type. • RAID Groups is a component type.
The following table provides the default set of metric categories that are displayed in the Available Metrics Choose Metric Category list for the XP and the XP7 disk arrays.
Custom groups navigation path The Custom Groups node comprises of individual custom groups that display the associated LDEVs. Following is the component selection path: • Custom Groups > Individual custom group > LDEVs (component type) > Individual LDEVs The serial numbers of the XP and the XP7 disk arrays to which the LDEVs belong are also mentioned in brackets beside the LDEV IDs. You can create a custom group that has multiple LDEVs from different XP and XP7 disk arrays.
• “LUSE navigation path” (page 255) • “Replication Volumes navigation path” (page 253) • “Host Groups navigation path” (page 257) • “Ext-RG(s) navigation path” (page 261) • “Drive types navigation path” (page 262) Searching for components You can navigate the Array tree by selecting an array from the array drop-down list and the component from the component drop-down list. The following components are supported for the search functionality: LDEV, RG, HG, Port, and Pool.
Plotting charts 267
Using charts
NOTE: • For the Raid Group, the Host Group branch is traversed first, followed by the Pool branch, Back-end, and finally the Drive Types branch. • You can search for External Raid Groups as well by selecting Raid Group from the component drop-down list and querying for a specific External Raid Group. • When searching for concatenated Raid groups, you should enter a part of Raid group name and not the entire name.
The Chart Work Area displays the following default settings. They are applicable across the chart windows until you select the other available options: • Time Line in the Chart Style list. This implies that the data points for the different components are plotted as a line graph. The breaks in the performance graphs can be observed, if there are missing performance data collection. • Duration as 1 hour.
NOTE: ◦ These selections work only on the active chart windows. ◦ If the total number of data points from all the performance graphs exceeds 500 in a chart window, the data points are not rendered to optimize the charting functionality in HP XP7 Performance Advisor. You can hover the pointing device over the line graphs to view the data points.
metrics from the same metric category. Performance Advisor plots the performance graphs incrementally and continues till the performance graphs for all the 250 components are plotted in the chart window. If you select more than 250 components, the performance graphs for the remaining set of components (beyond 250) are plotted in the subsequent chart window that automatically appears in the Chart Work Area. During the process of plotting the performance graphs, the Loading charts...
For more information on the tasks that you can perform in the Chart Work Area, see “Using chart controls and settings” (page 277). Viewing top 20 consumers of an MP blade IMPORTANT: This section is applicable for P9500/XP7 disk arrays. The top 20 consumers can be LDEVs, continuous access journal groups, or the E-LUNs (external volumes) that are assigned to an MP blade.
MP blade utilization by top 20 consumers Example (see Figure 29 (page 273)) whether the frontend or the backend requests have been high.
Select an MP blade from MP Blades in the component selection tree and choose the MP Blade Util/Processing Type metric in the Available Metrics Choose Metric Category list. For more information, see “MP Blades navigation path” (page 243). A stacked area graph is displayed in a separate Utilization Metrics chart window and displays the MP blade utilization split up for the different processing types. Each area represents the percentage of average MP blade utilization by an individual processing type.
Viewing aggregate data for metrics You can view the average utilization for the components in a metrics category using the Stacked button in the Charts screen. Select the required in the component selection tree, and then choose the appropriate metric for which you want to view the average utilization data in the Available Metrics Choose Metric Category list. NOTE: You can select a maximum of eight components. The system does not display the stacked chart if more that eight components are selected.
Aggregate Data Example (see Figure 31 (page 276)) Average utilization metrics value for the specific date and time stamp (average utilization metrics percentage for the specific date and time stamp) 12110 (68.4%) Sum of all the data points for the specific date and time stamp total: 17709 NOTE: In the stacked chart view, the system enables you to select maximum eight components.
2. Click Add New to add a new chart window. The new chart window is automatically selected (blue border appears around the active chart window). The performance data points of components that you select in the component selection tree for metrics in the same metric category are added to the new chart window till you clear the selection.
3. Click Save to save the selected charts as favorite charts. You can provide a name for the favorite chart by clicking in the respective text box and entering the name. If you do not provide a name, by default, the metric category title of the chart window is considered as the favorite chart name. The following are a few points that you must note while specifying a favorite chart name: • The name should have only alphanumeric characters.
1. Click Load Fav Chart(s). A pop-up dialog appears displaying the favorites charts that you can view. 2. Select one or more favorite charts from the list and click View Chart. The favorite chart appears in the Chart Work Area and is selected by default. • You can add components for metrics in the same metric category to this favorite chart and save it with the same name, or provide a different name.
NOTE: • To create a report, it is mandatory that you provide the report name, array model, and report type. • The Report Name, Customer Name, Consultant Name, and Array Location are pre-populated in the respective fields if you have already configured them as common settings on the Email Settings screen. For more information, see “Configuring email and SNMP settings” (page 73). If you do not want these default descriptions, modify the respective fields.
7. Click Generate to view the report immediately. Click Save to save and view the report later. HP XP7 Performance Advisor saves the report in its database and also displays a record for the report in the Reports section (Reports+View Reports). By default, the new record is displayed at the end of the list. The following details along with those you provided while creating a report are displayed for the report record in the Reports section: • User Name: The name of the user who created the report.
Viewing current LDEV assignments for an MP blade IMPORTANT: This section is applicable only for the P9500/XP7 disk arrays. You can view the LDEVs that are assigned to an MP blade for the duration that you select in the Chart Work Area. This data helps you to identify the MP blade that is processing requests for an LDEV. Based on this data, you can perform the necessary action.
LDEV - MP blade assignment Example (see Figure 32 (page 283)) MPB-1MA is the MP blade ID, where 1 indicates the cluster # and MA indicates the blade location. Forecasting utilization You can forecast utilization of the following components in charts: • MP Util (%) • Write Pending (%) • DKA Util (%) • RG Util (%) • ThP Util (%) • MP Blade Util (%) IMPORTANT: • The forecast on the MP Util (%) and DKA Util (%) are available only for the XP disk arrays.
In the preceding utilization forecast graph, the threshold value is displayed as a blue reference line and the forecast appears as a green line. IMPORTANT: • Ensure that at least a minimum of 21 data points are available to begin the utilization forecast. • To forecast utilization for a week, HP recommends that there be a minimum of 250 data points or the performance data has been collected for two or more days.
when the chart is initially updated for 5 minutes. The data points appear in the next update cycle only for the delta duration. When you click Start Updating, the chart re-renders itself to show the new values that are collected from the host agent. The Start Time displays the time when the automatic update started, and the End Time displays Continuous Update. It implies that HP XP7 Performance Advisor continuously updates the chart with the newest data points till the time you click Stop Updating.
by taking the average of the previous data points. You can specify the number of data points for which the average needs to be calculated, using the Point Factor list. The minimum that you can select from the Point Factor list are 2 points and the maximum are 24 points. IMPORTANT: • HP recommends that you select minimum Point Factors for accuracy and better view of the graph that is plotted. • Moving Average is calculated as the average of the initial set of data points.
provides you an approximate idea of the performance of components if the data collection was active during the specified time interval. Once the data collection resumes, the data points are again plotted simultaneously for the selected components.
Zooming in on data points across performance graphs In addition to zooming in on data points for a particular duration, you can also zoom in on a combination of data points in the chart window. If zoom preview is enabled, it also highlights the focused area in the chart window. To zoom in on data points in the chart window: • Holding down the mouse button, drag the pointer across the data points that you want to focus on. The chart window displays the focused set of data points.
In the Zoom Preview panel, if you plot the chart for more than one day, the chart displays data with date stamp. Rearranging or moving chart windows To move or rearrange chart windows in the Chart Work, click in the title bar of the chart window that you want to move and holding down the left mouse button, drag and drop that chart over an existing chart, where you want the new chart to be placed in the Chart Work Area.
Removing chart windows You can remove all the charts currently displayed in the Chart Work Area by clicking Close Charts. All the active and passive chart windows are removed from the Chart Work Area.
11 Using reports This chapter discusses the following topics: • “Generating, saving, or scheduling reports” (page 298) • “Viewing a report” (page 306) • “Viewing a schedule” (page 307) • “Virtualization for reports” (page 307) • “Logging report details and exceptions” (page 310) Introduction Reports provide history of performance data collected for a specified XP or an XP7 disk array, where a visual representation of the performance trend of components is shown for a duration that you specify.
Report types Description For XP disk arrays • Total I/O Rate Detail • Read-Write Ratio For P9500/XP7 disk arrays Performance report Findings section. • Read-Write Ratio by hour of day • Read-Write Detail • Max/Min Frontend Port IOPS • Max/Min Frontend Port MB/s In addition, it includes a section called Findings at the beginning of the report. ACP Utilization The ACP Utilization report Yes provides data on the utilization of various installed ACP/DKA pairs for the duration that you specify.
Report types Description For XP disk arrays For P9500/XP7 disk arrays and ranges from 8 - 128 for the frontend and the backend LDEVs, and 8 - 32 for the frontend and the backend RAID groups. For more information, see “Creating a report for the busiest LDEVs and RAID groups” (page 303). LDEV Activity The LDEV Activity report Yes provides data on the average performance and the utilization of LDEVs.
Report types Description For XP disk arrays For P9500/XP7 disk arrays volumes that are assigned to a pool. MP Blade Utilization The MP Blade Utilization report No provides data on the average utilization of each installed MP blade. In addition, the following are also included in the report for each MP blade: Yes • The top 20 consumers (LDEVs, continuous access journal groups, or E-LUNs) and their average utilization of the CPU cycles. • The average MP blade utilization by each processing type.
Report types Description For XP disk arrays For P9500/XP7 disk arrays Yes Yes components for the following: • Random Read • Random Read Cache • Random Write • Sequential Read • Sequential Read Cache • Sequential Write 2.
IMPORTANT: • • Reports on the following are available only if they are configured in the selected XP or XP7 disk array. If not configured, they are not even displayed as options to select for create their reports. In addition, they are also not displayed in other related reports, like the Array Performance and the All reports.
Generating, saving, or scheduling reports You can generate a report, where you view only a temporary copy of the report. You can also save a report, where a copy of the report is retained in HP XP7 Performance Advisor for your later reference. In addition to the above-mentioned, schedule a report on a periodic basis, where data is automatically provided in the corresponding report for the duration that you specify.
2. Select or enter the following details: • Name of the report in the Report Name box. The name should not be less than 2 characters or exceed 80 characters in length. • Name of the customer or company in the Customer Name box. • Name of the consultant in the Consultant box. • Location for the array in the Array Location box. • Select one of the following: Array or Template or Host Group option from the Based on option. • Select the array type from the Array Type drop-down list.
You can also select multiple reports and view the corresponding data in a single report document. The data for each report is arranged based on the order in which you selected them while creating or scheduling a report. Use the Shift or the Ctrl key for selecting multiple reports. Alternatively, use the Up and the Down arrow keys with the Shift and the Ctrl keys. NOTE: • ◦ The LDEV Activity report output is always in a .csv format.
3. Generate or save the report. • To generate a report, click Generate. HP XP7 Performance Advisor does not save the report in its database or display records for the report in the Reports section (Reports+View Reports). Instead, view only a temporary copy of the report. The report cannot be retrieved once it is closed.
1. Collection Schedule: displays Daily, Weekly, and Monthly. By default, Weekly is selected as the collection schedule. • Day of the Week: Displays the list of week days. Select the week day when you want the schedule to be executed. By default, Weekly is selected as the default collection schedule. • If you select Monthly as the collection schedule, the Monthly Schedule is displayed. The following options are provided in a monthly schedule: • 2.
4. Click Save. HP XP7 Performance Advisor does the following: • Saves the schedule and also displays a record for the schedule in the Scheduled Reports section (Reports+View Reports). The following details along with those you provided while scheduling a report are displayed for that schedule in the Scheduled Reports section: ◦ Occurrence: Displays number of times a particular schedule is repeated. The occurrence is aligned to the selected schedule frequency.
The RAID groups and LDEVs selection is in multiples of eight. If you do not select any value from the respective drop-down lists, by default, the LDEV IO report is generated for the eight busiest frontend and eight backend LDEVs, and eight frontend and eight backend RAID groups. Further, the report displays the graphs for only those LDEVs that have the associated I/Os and those RAID groups on which the I/Os transactions have occurred.
To generate, save, or schedule an LDEV Activity report, follow the procedure given for creating or scheduling a report. For more information, see “Generating, saving, or scheduling reports” (page 298). In addition, ensure that the following steps specific to an LDEV Activity report are also completed: 1. Select LDEV Activity from the Report Type list. 2. 3.
Viewing reports IMPORTANT: • Report schedules with an asterisk (*) before the User Name indicate that they are generated by a schedule. Following is the naming convention for reports that have an associated schedule: ____
• “Scheduling reports” (page 301) • “Viewing a schedule” (page 307) • “Logging report details and exceptions” (page 310) Deleting reports To delete a report: 1. Click Reports+View Reports in the left pane. 2. In the Reports section, select the check box for the report record that you want to delete. 3. Click Delete. Click OK when prompted to confirm. The report copy is also deleted from the :\%HPSS_HOME%\pa\tomcat\ webapps\pa\reports folder. Click Cancel to retain the records.
IMPORTANT: • The Scheduled Reports section appears only if you have logged in as an Administrator or a user with administrator privileges. • If the Email Dest for a schedule record is blank, it implies that the report is scheduled, but an email address is not provided or is invalid. In such cases, you do not receive any notification though the report is generated. You need to go to the following location and select the report you want to view: :\%HPSS_HOME%\pa\tomcat\webapps\pa\reports.
In the preceding image, you can view the report, PA_ACP_Rep that is executed on 2009-10-11 20:11:32 IST (Generation Time). The report provides data on ACP Utilization in an XP disk array, 82502 for a period of 1 month (2009-09-11 to 2009-10-11). The report is provided in HTML format. The Email Dest column is blank for this record, which implies that a schedule is not created for this report.
XP7 Performance Advisor is supposed to generate a report on the second Thursday of every month at 00:00 hours. Hence, the schedule is active and a report is generated on 11th September 2008 at 00:00 hours. The End Time for this schedule displays 12.11.2008 00:00:00, which means the last report that HP XP7 Performance Advisor generates is on 11th December 2008 at 00:00 hours. This is because, while creating the schedule, the number of times it should repeat is given as 4 in the Occurrence box.
12 Using Performance Estimator for XP disk arrays This chapter discusses the performance estimation for XP disk arrays. IMPORTANT: arrays. The Performance Estimator does not support XP7, XP20000, and XP10000 disk Introduction HP XP7 Performance Advisor enables you to determine the optimal performance of your XP (XP24000, XP12000, P9500) disk Arrays after configuration collection is complete for these XP disk arrays. It provides a framework called the Performance Estimator for estimating their performance.
• Workload – 8K Random Writes • Intensity – 4096 threads/sec HP XP7 Performance Advisor estimates: • 576 disks (Number of Disks) are required • I/Os on the disk set would be 46442/sec • MB/s that the array can receive per second would be 380 MB • Time taken for the array to respond (R.T (ms) for the read—write requests would be 91 R.
you place the triangular button on the horizontal scroll bar. You can also enter a different RAID group number, increment, or decrement this number using the triangular buttons that appear next to the text box. d. e. From the Workload list, select the workload for which you want to estimate the performance of the XP disk array.
Based on the above selection, the Performance Estimator displays the estimated values in the following non-editable text boxes: • Raw Capacity - Indicates the cumulative disk space that is available (for both data storage and parity operations) for the selected configuration. • R1/R5/R6 Usable (GB) - Indicates the disk space that is available as data storage for the selected configuration. The value shown is applicable only for the R1 and R5 RAID types.
maximum of 512 RAID groups for RAID 1 (2D+2D) and 256 RAID groups for RAID 5 (7D+1P). Accordingly, the text box on the right side of the # RGs horizontal scroll bar displays the selected number of RAID groups. The RAID groups number varies depending on where you place the triangular button on the horizontal scroll bar. You can also enter a different RAID group number, increment, or decrement this number using the triangular buttons that appear next to the text box. d. e.
Based on the above selection, the Performance Estimator displays the estimated values in the following non-editable text boxes: • Raw Capacity - Indicates the cumulative disk space that is available (for both data storage and parity operations) for the selected configuration. • R1/R5/R6 Usable (GB) - Indicates the disk space that is available as data storage for the selected configuration. The value shown is applicable only for the R1 and R5 RAID types.
13 Troubleshooting issues for components associated with applications This chapter discusses troubleshooting issues for disk array components associated with applications that reside on hosts, which communicate with the disk arrays. The troubleshooting is possible using the real-time charting or using the host group or WWNs of the hosts.
you can collect the real-time performance data for a set of five LDEVs, RAID groups, ports, cache, and MP blades in an P9500 and XP7 disk array. This data is collected for a set of real-time metrics that HP XP7 Performance Advisor supports. When you start a real-time performance data collection for an XP or an XP7 disk array, the following sequence of steps follows: 1.
Figure 34 RealTime screen Screen elements Description Start Collections tab • After the configuration data is collected for the XP/XP7 disk arrays, they are displayed for selection in the Select Components list, under Start Collections tab. • The disk array components are displayed for each XP or XP7 disk array.
Screen elements Description real-time metrics in the Choose Metrics list. • The associated host names are also populated in the HostAgent list. By default, the first host in this list is associated with the first XP or XP7 disk array displayed in the Select Components list. You can select the XP/XP7 disk array and related components for which you want to collect the real-time performance data.
If you want to start the real-time collection using the same host agent for which the real-time server update is in progress, the following error message is displayed: Real Time Server Configuration data is getting updated on the selected HA. Please select any other HA. You must wait for the real-time server update to complete if you want to use the same host agent.
3. • HostAgent list: Displays the host agent that is connected to the selected XP or XP7 disk array. • Command device list: Displays the command devices for the selected XP or XP7 disk array. These command devices communicate with the host agents displayed in the HostAgent list. • Choose Metrics list: Displays the set of real-time metrics based on the category that you select. Click the plus (+) sign for a component category to view the associated list. NOTE: 4. 5. 6. 7.
8. Click Start Plotting. HP XP7 Performance Advisor plots the performance graphs in the Chart Work Area as and when the real-time performance data is collected for the selected components. For more information on using charts, see “Plotting charts” (page 234). The following image shows the real-time charting graph for 10055, which belongs to the XP12000 Disk Array type.
4. Click Stop Plotting. The real-time data collection stops and the record removed from the list for the selected XP or XP7 disk array. Troubleshooting using host group or WWN Introduction HP XP7 Performance Advisor helps identify bottlenecks in the performance of applications that reside on hosts and use the XP and the XP7 disk arrays for storing their data. The hosts are identified using their host groups or WWNs. These hosts might not have HP XP7 Performance Advisor host agents installed.
Host Based Troubleshooting Screen You can view the performance data of the LDEVs and associated components for an application on the Troubleshooting screen. This screen appears when you click Troubleshooting+Host Based in the left pane. “Host Based Troubleshooting Screen” (page 325) displays the Troubleshooting screen.
IMPORTANT: • Your application can be associated with LDEVs that are made available through different hosts and WWNs. • There is no limit on the number of applications that you can associate with hosts and WWNs. To start troubleshooting performance issues of components that are associated with an application: 1. Click Troubleshooting+Host Based in the left pane.
The following are the possible combinations: 7. • Associate a new application with a new host group or WWN. • Associate an existing application with a new host group or WWN. Click Add/Remove. You are shown an informational message that the application settings are saved. 8. 9. Click Close to come back to the Troubleshooting screen. Click the + sign for the XP/XP7 disk array in the component selection tree to view the following structure in the order mentioned: 1. Application name 2.
6. Click Add/Remove. You are provided an informational message that the application settings are removed. 7. Click Close to come back to the Host Based screen. NOTE: • Any changes made to the host configuration (that is adding or deleting LUN paths) is not reflected unless you re-configure the application (that is delete the existing application that is configured and re-create it in the Troubleshooting —> Host Based screen).
The Search Results dialog box appears and displays the application and the host group or WWN of the host that are associated with the component. 4. Click the link provided for the application, host group, or WWN in the Search Results dialog box. If your application is associated with a host using its host group, N/A is displayed under the WWN column. Similarly, if your application is associated with a host using its WWN, N/A is displayed under the Host Group column.
1. Click the plus (+) sign for an XP or an XP7 disk array in the component selection tree under Troubleshooting+Host Based. The list expands to display the configured applications. The applications displays the associated host groups or WWNs. You can also search for an application that is using the components in an XP or an XP7 disk array. For more information, see “Searching for applications associated with components” (page 328).
2. Based on your requirement, select an application or choose the host group or the WWN associated with an application: If your selection is at the application level, the data displayed for the LDEVs and the associated components is through all the host groups or WWNs associated with the application. Hence, the data is a superset of the data that you view at the host group or the WWN level.
Click an LDEV ID to view the associated port, CLPR, and the RAID group records highlighted in the respective tables. By default, the port, CLPR, and the RAID group records are displayed for the first LDEV listed in the LDEV table.
In addition, the following are displayed: • The MP blade ID with its corresponding average utilization percentage in brackets. For example, MPB-1MA [9.34]. MPB-1MA is the MP blade ID that belongs to the Cluster 1 and the blade location MA. Its average utilization percentage is 9.34%. • The replication status for the LDEVs under Replication Attribute. This data helps you to understand if a particular LDEV is being used as a replication volume (continuous access or business copy volume).
In addition, the following details are also displayed: • RAID group table: ◦ DKA Pair: Displays the DKA pair associated with the particular LDEV. ◦ RG: Displays the RAID group number associated with the particular LDEV. ◦ Pool ID: Displays the ThP pool ID. NOTE: For XP disk arrays prior to the XP24000 Disk Array, NA is displayed under Pool ID, as the ThP cannot be configured on XP disk arrays prior to the XP24000 Disk Array.
health” (page 106). For more information on setting threshold values, see “Configuring dashboard threshold settings” (page 98). You can also forecast the component utilization based on the array type. • For an XP disk array, forecast the DKA, RAID group, cache write pending, and the MP utilization. • For an P9500/XP7 disk array, forecast the cache write pending, MP blade, and the RAID group utilization. For more information, see “Forecasting utilization” (page 284).
Table 31 Additional metrics for RAID groups, ports, and CLPRs Resources Additional Frontend, Cache, and Backend metrics Description RAID groups Non Seq Reads The total backend tracks loaded in random mode for a specified RAID group. Seq Reads The total backend tracks loaded in sequential mode for a specified RAID group. Writes The total backend tracks destaged for a specified RAID group. Max IOPS The average I/Os on the port over an entire collection interval.
HP XP7 Performance Advisor analyses the previous average read and write response values of an LDEV for the duration that you specify in the User Settings screen (see “Setting the duration to predict the LDEV response time” (page 79)). It computes a reference value based on the actual data for the specified duration and verifies whether the average read and write response values of an LDEV are within or beyond the reference value.
3. Select the check box for the metric, for which you want to view the performance graph of the selected components and click OK. HP XP7 Performance Advisor plots appropriate performance graphs in the Chart Work Area. By default, the data points are plotted for the last one hour of the management station's time. For more information on using charts and chart options, see “Plotting charts” (page 234).
6. 7. 8. 9. Note the IOPS and MBPS for 1A. Plot a chart of the trend of IOPS and MBPS. Identify the MP associated with port 1A and note the utilization of the MP. Plot a chart of the trend of MP utilization. Note the IOPS and MBPS for 5A. Plot a chart of the trend of IOPS and MBPS. Identify the MP associated with each of the ports 5A and note the utilization of the MP. Plot a chart of the trend of MP utilization.
2. 3. 4. 5. 6. Navigate to the troubleshooting screen. Select the XP array. Select the application. Identify CLPR associated with the LDEVs mapped to the application. In this case, this should bring up CLPR10. Note the cache usage and read hits on the CLPR10 and plot a chart of the read hits. The trend should indicate a lower value for read hits and higher value for cache usage. 7. Note the read/write pattern for each of the LDEVs associated with the application.
14 Launching HP XP7 Performance Advisor from other Storage products Introduction You can launch HP XP7 Performance Advisor from P9500/HP XP7 Tiered Storage Manager and HP XP7 Remote Web Console. Launching HP XP7 Performance Advisor from HP XP7 Tiered Storage Manager HP HP XP7 Tiered Storage Manager is used to perform migration, where the data stored on predefined set of volumes is moved to another set of volumes with the same characteristics.
1. 2. On HP XP7 Command View Advanced Edition Suite, click the Mobility tab to view the list of the logical groups created. The logical groups contains the list of volumes which are grouped logically to migrate. From the list of logical groups, select the group for which you want view the performance graphs of the associated LDEVs. The logical groups and the volumes in the groups are displayed. 3. 4. Click Logical Groups. Click the logical group for which you want to analyze performance.
Viewing performance graphs for RAID groups To access HP XP7 Performance Advisor from HP XP7 Tiered Storage Manager and view the charts for the RAID groups that belong to a storage domain: 1. On HP XP7 Command View Advanced Edition Suite, click the Mobility tab to view the list of the THP pools created for each array. 2. From the list of THP pool, select the THP pool for which you want to view the performance graphs of the parity groups from which the THP pool is created. 3. Click the Parity Groups tab. 4.
make provisioning decisions. HP XP7 Performance Advisor displays usage data for the following components: • Parity groups or RAID groups • MP blade processors or MP blades • Logical Devices or LDEVs • Host groups NOTE: This section covers tasks that must be completed to launch HP XP7 Performance Advisor from HP XP7 Remote Web Console. For more information on Remote Web Console, see the product documentation.
2. Do one of the following: • To update the IP address, open the appDefinition.xml file in Notepad and update the HP XP7 Performance Advisor management station IP address for the tag as shown: Syntax:
IMPORTANT: Whenever you update the appDefinition.xml file for the management station IP address or the appProfile.xml file for the session name, execute the above-mentioned commands, so that HP XP7 Remote Web Console uses the latest XML files to launch the HP XP7 Performance Advisor session. Also, if a session of HP XP7 Remote Web Console is already open, log out and log in to view the updated session details.
5. Click Settings+Launch Application+Performance Advisor. If you have updated a different session name in the appDefinition.xml file, that session name appears when you click Settings+Launch Application. NOTE: If none of the components are selected, the session will be in the disabled mode. The session is enabled only when you select a particular component. Figure 36 HP XP7 Remote Web Console screen The session opens in a separate browser window.
5. Click Settings+Launch Application+Session Name (default: Performance Advisor). The data for the selected processor blade is displayed in the HP XP7 Performance Advisor, Array View - MP Blades screen. If multiple processor blades are selected, the data related to the first selected processor blade is displayed. For more information on MP Blades screen, see “Viewing MP blade utilization for P9500/XP7 disk arrays” (page 193).
The following image shows the processing distribution for MPB-1MA. To view the utilization data for MPB2, click MPB-2MC in the MP Blade Configuration group box in the Array View - MP Blades screen. Viewing Parity Group data Consider the scenario of five RAID groups (preferably belonging to the same drive type). You want to know which is the least busiest RAID group, so that you can provision storage space from the RAID group to create new LDEVs in that RAID group.
4. Click Settings+Launch Application+Session Name (default: Performance Advisor). By default, the utilization data for the Overall RAID Group utilization metric is displayed in the Utilization Metrics chart window. The overall RAID group utilization is the total busy rate of the RAID group over an entire collection interval. When a RAID group is associated with a ThP pool, this metric provides the extent to which a RAID group is busy because of the I/Os occurring on a ThP pool.
1. 2. 3. 4. Complete steps 1 and 2 mentioned for “Launching HP XP7 Performance Advisor” (page 346). Select Logical Devices in the list displayed for the XP7 disk array serial number. In the right work area, select the Logical Device record for which you want to view the usage and performance data in Performance Advisor. Click Settings+Launch Application+Session Name (default: Performance Advisor).
4. Click Settings+Launch Application+Session Name (default: Performance Advisor). The host group and the usage data of ports and LDEVs associated with the selected host group are displayed in the Array View - LDEV screen. The above image displays the LDEVs and ports associated with the host group san-ita1. The Chart Work Area in the above image displays the maximum, minimum, and average I/O on the port CL2D that is selected in the Array View - LDEV screen. Sample on appDefinition.xml and appProfile.
/pa/RWC PA Test In the appProfile.xml file, display_ID refers to the XP7 disk array components in HP XP7 Remote Web Console. The performance data in the form of historical and summary data is displayed for the following components in HP XP7 Performance Advisor. Table 32 Display ID information Display ID Description V4-3 View the performance data of MP blades.
15 Support and other resources Contacting HP HP technical support For world wide technical support information, see the HP support website: http://www.hp.
Websites • HP.com http://www.hp.com • HP Storage http://www.hp.com/go/storage • HP Manuals http://www.hp.com/support/manuals • HP download drivers and software http://www.hp.com/support/downloads • HP Software Depot http://www.software.hp.
Typographic conventions Table 33 Document conventions Convention Element Blue text: Table 33 (page 356) Cross-reference links and email addresses Blue, underlined text: http://www.hp.
A Appendix A Storage management logical partitions (SLPRs) A disk array can be shared with the multiple organizations and with multiple departments within an enterprise. Therefore, multiple administrators might manage a single disk array. This circumstance creates the potential for an administrator to destroy volumes of other organizations, and it can complicate and increase the difficulty of managing the disk array.
host. This approach minimizes the effects of one administrator's operations on the volumes of other administrators. Figure 38 Example of a CLPR “Example of a CLPR” (page 358) displays how a corporation's cache memory is partitioned to three virtual cache memories. Although the Branch A host is inputting and outputting a large amount of data, the Branch B and Branch C hosts are unaffected because each branch is allocated 40 GB CLPR.
B Sample reports Report types HP XP7 Performance Advisor supports report generation for the following categories: • “Array performance reports” (page 359). • “LDEV IO reports” (page 367). • “RAID Group Utilization Report” (page 370). • “Cache utilization reports” (page 370). • “ACP utilization reports” (page 373). • “CHIP utilization reports” (page 374). • “XP Thin Provisioning (THP) pool occupancy” (page 376). • “Snapshot pool occupancy” (page 377).
NOTE: The backend transfer is the block of data that is transferred between the XP/XP7 disk array cache and the RAID groups. Every read cache miss results in a backend transfer. Following is a sample Findings section for an XP7 disk array: A sample of each report is given below: Total I/O Rate report The Total I/O Rate report displays in a chart format, the number of total read and write I/O operations over the entire period.
Figure 39 Total I/O Rate The total backend transfers may be compared to the total frontend I/Os and the difference is due to the effects of the array cache. The total backend transfers load is taken by the RAID groups and ACP/DKA pairs, where as the total frontend I/O load is taken by the CHIP/CHA ports. NOTE: If there are no data points available for the dates selected, a blank chart is displayed.
Figure 40 Total I/O Rate by hour of day The total backend transfers may be compared to the total frontend I/Os and the difference is due to the effects of the array cache. The total backend transfers load is taken by the RAID groups and ACP/DKA pairs, where as the total frontend I/O load is taken by the CHIP/CHA ports. NOTE: If there are no data points available for the dates selected, blank chart is displayed.
Figure 41 Total I/O Rate Detail The sequential frontend I/Os are when data is read from or written to consecutive addresses. The random frontend I/Os are when applications address non-consecutive blocks of data. CFWs are a special class of I/Os generated by HP's XP7 Continuous Access Remote Mirroring software. NOTE: If there are no data points available for the dates selected, blank chart is displayed.
Figure 42 Read/Write Ratio For example, the data point of X on the graph indicates X% read activity and (100-X)% of write activity. NOTE: If there are no data points available for the dates selected, blank chart is displayed. If all the data values are zero for the dates selected, a chart with a horizontal line along X axis is displayed in the center of the chart.
Figure 43 Read/Write Ratio by hour of day NOTE: If there are no data points available for the dates selected, blank chart is displayed. If all the data values are zero for the dates selected, a chart with a horizontal line along X axis is displayed in the center of the chart. Read/Write Detail report The Read/Write Detail report displays in a chart format, the total I/Os separated into different I/O types.
Figure 44 Read/Write Detail NOTE: If there are no data points available for the dates selected, blank chart is displayed. If all the data values are zero for the dates selected, a chart with a horizontal line along X axis is displayed in the center of the chart. Max/Min Frontend Port IOPS report The Max/Min Frontend Port IOPS report displays in a chart format, the total maximum and minimum frontend port I/O operations per second over the entire data collection period.
NOTE: If there are no data points available for the dates selected, blank chart is displayed. If all the data values are zero for the dates selected, a chart with a horizontal line along X axis is displayed in the center of the chart. Max/Min Frontend Port MB/s report The Max/Min Frontend Port MB/s report displays in a chart format, the total maximum and minimum frontend port MB/s over the entire data collection period.
In the LDEV I/O Mapping table: • Hyphen (-) is displayed in the RAID Format column if that RAID format is not applicable for THP Pool V-Vols. • Hyphen (-) is displayed in the LUSE Master column if the LDEV record is not a LUSE Master. So, the LDEV will either be a LUSE component or an individual volume (not part of any LUSE). • Hyphen (-) is displayed in the LUSE Status column if the LDEV record is neither a LUSE master nor a LUSE component. The LUSE Status is not applicable for such LDEV records.
throughput of the hardware. The maximum throughput varies depending on RAID level, disk mechanism type, and other factors such as the size of the individual I/Os. “Total Backend I/O Rate First Top 8 Array Groups” (page 369) displays a sample Total Backend I/O Rate First Top 8 RAID Groups report for the XP1024 Disk Array.
Figure 50 Total Frontend I/O Rate First Top 8 Array Groups/Pools RAID Group Utilization Report The Raid Group Utilization report consists of four charts that display the utilization of the top 32 RAID groups, split into eight each. The RAID group utilization indicates the total utilization of a RAID group over an entire collection interval.
Cache Utilization report The Cache Utilization report displays in a chart format, the cache utilization in an XP or an XP7 disk array. “Cache Utilization” (page 371) displays a sample Cache Utilization report for a P9500 Disk Array. Figure 52 Cache Utilization Cache Write Pending report The Cache Write Pending report displays in a chart format, the amount of data in the cache waiting to be written to a disk. It helps determine the amount of cache available.
Figure 54 Percentage read hits Total Backend Transfer report The Total Backend Transfer report displays in a chart format, the total number of transfers, sequential, random drive-to-cache, and cache-to-drive, per second. “Total Backend Transfer report” (page 372) displays a sample Total Backend Transfer report for a P9500 Disk Array.
Figure 56 Total Backend Transfer by Hour of the Day Cache Side File Utilization report The Cache Side File Utilization report displays in a chart format, the cache side file utilization. The cache side file utilization is used for the Continuous Access Async Software. It holds the data buffers that have not been acknowledged by the remote host. “Cache Side File Utilization” (page 373) displays a sample Cache Side File Utilization report for a P9500 Disk Array.
Figure 58 ACP utilization over the entire period ACP Utilization by Hour of the Day report The ACP Utilization by Hour of the Day report displays in a chart format, the average utilization of the installed ACP/DKA pairs over a 24-hour period. “ACP utilization over a 24-hour period” (page 374) displays a sample ACP Utilization by Hour of the Day report for an XP24000 Disk Array.
The CHIP utilization reports allow you to view in a chart format, the utilization data for all the installed CHIPs/CHAs in the array, and the average utilization data for all the installed CHIPs/CHAs in an XP disk array. While generating a CHIP utilization report, you can select one or more CHIPs from the Available CHIPs list. If you select All and set the long duration, HP XP7 Performance Advisor takes more time to generate the reports. HP recommends that you select few CHIPs when the duration is long.
Figure 61 CHIP Utilization by Hour of the Day CHIP Processor Utilization report The CHIP processor utilization report displays in a chart format, the individual MP utilization on an installed CHIP/CHA. “CHIP Processor Utilization” (page 376) displays a sample CHIP processor utilization report for an XP24000 Disk Array. Figure 62 CHIP Processor Utilization In this sample report, the individual MP utilization for the CHA 1E is displayed. Similarly a report is generated for all the installed CHIPs/CHAs.
“XP Thin Provisioning pool occupancy” (page 377) displays a sample ThP Pool Occupancy report for a P9500 Disk Array. Figure 63 XP Thin Provisioning pool occupancy Snapshot Pool Occupancy report The Snapshot Pool Occupancy report provides the usage percentage of the eight busiest snapshot pools. NOTE: HP XP7 Performance Advisor reports only those snapshot volumes in an XP or an XP7 disk array that are assigned to a pool.
Continuous Access Journal Group utilization report The Journal Pool Utilization report displays the utilization percentage of the eight busiest Journal groups. “Continuous Access Journal group utilization” (page 378) displays a sample Continuous Access Journal Group Utilization report for a P9500 Disk Array. Figure 65 Continuous Access Journal group utilization LDEV Activity report You can view the maximum and least busiest LDEVs in an XP or an XP7 disk array through the LDEV Activity report.
Figure 66 LDEV Activity report IMPORTANT: • The threshold limits that you specify are independent of each other and applicable to only the category that you select. You can set both the maximum and minimum threshold levels, or one of them based on your requirement. • The report also provides the associated drive types for the LDEVs. This information helps you to identify if the associated drive is supporting the required LDEV performance. If not, move the LDEV to a different drive type.
All report Based on whether you generate the All report for an XP disk array or an XP7 disk array, the All report consolidates data and provides a single report for the following reports in the selected date and time range: XP Disk Array: • Array Performance • LDEV IO • RAID Group Utilization • Cache Utilization • ACP Utilization • CHIP Utilization • Journal Pool Utilization • ThP Pool Occupancy • Snapshot Pool Occupancy P9500/XP7 disk array: • Array Performance • LDEV IO • RAID Group
MP blade utilization by top resources The average utilization of an MP blade by the top 20 consumers is displayed in a chart for the selected duration. The top 20 consumers can be LDEVs, continuous access journal groups, or the E-LUNs (external volumes). For more information, see “Viewing top 20 consumers of an MP blade” (page 273). MP blade utilization by the processing types The average MP blade utilization split up for the different processing types is displayed in a chart for the selected duration.
For more information on processing types, see “Viewing MP blade utilization by processing types” (page 274).
C Appendix C Supportability matrix The following matrix displays the supportability of ThP, snapshot, and continuous access journal volumes on the XP arrays.
D Appendix D Array mapping “XP12000” (page 384) lists the ACP and CHIP pairs for XP12000 type array.
Table 37 XP24000 (continued) Slot name Pair ID Slot ID EU, QU CHIP Pair 1 CHIP EU=0; QU=8 FU, RU CHIP Pair 2 CHIP FU=2; RU=10 EL, QL CHIP Pair 3 CHIP EL=1; QL=9 FL, RL CHIP Pair 4 CHIP FL=3; RL=11 GU, TU CHIP Pair 5 CHIP GU=4; TU=12 HU, UU CHIP Pair 6 CHIP HU=6; UU=14 GL, TL CHIP Pair 7 CHIP GL=5; TL=13 HL, UL CHIP Pair 8 CHIP HL=7; ,UL=15 AU, MU CHIP Pair 9 CHIP AU=16; MU=24 BU, NU CHIP Pair 10 CHIP BU=18; NU=26 AL, ML CHIP Pair 11 CHIP AL=17; ML=25 BL, NL CHIP Pair 12
E Metric Category, metrics, and descriptions Metrics and descriptions “Metric Category, metrics, and descriptions” (page 386) provides the metric categories and metrics that are available in each of the metric categories, and the metric descriptions. Table 39 Metrics and descriptions Metric category Metric Description Frontend IO Metrics ACP Total IO – Frontend The total frontend I/Os (random plus sequential) on all the RAID groups managed by the ACP pair.
Table 39 Metrics and descriptions (continued) Metric category Metric Description Total Random Read-Frontends The total random frontend reads rate on this external volume during the entire collection interval. Total Random Reads Cache Out of the total random Hit-Frontend frontend reads rate on this external volume, the number of random reads available in the cache. Total Random Write Frontend The total random frontend writes rate on this external volume during the entire collection interval.
Table 39 Metrics and descriptions (continued) Metric category Metric Description LDEV, the number of random reads available in the cache. LDEV Random Writes – Frontend The total random frontend write I/Os on this LDEV during the entire collection interval. LDEV Total Sequential IO – Frontend The total sequential frontend I/Os rate on this LDEV over an entire collection interval. LDEV Sequential Reads – Frontend The total sequential frontend I/Os rate on this LDEV for a given range of time.
Table 39 Metrics and descriptions (continued) Metric category Metric Description example, if collection interval is set to five minutes, the maximum port IO value is collected and verified against the previous value every one minute, and the highest port I/O value collected in the last five minutes is considered. Average Port IO – Frontend The average frontend I/Os rate on this port over an entire collection interval. Port Average IO shown in PA is average of average IO.
Table 39 Metrics and descriptions (continued) Metric category Metric Description Total IO Writes – Frontend The total IO writes of all the LDEVs created in a specified RAID group for the given Host group over the entire data collection interval. The total IO writes is obtained by summing up IO writes of all the LDEVS for the given host group.
Table 39 Metrics and descriptions (continued) Metric category Metric Description Total Random IO - Frontend The sum total of random frontend I/Os on individual Virtual volumes defined in this pool. Total Random Reads Frontend The sum total of random frontend read I/Os on individual Virtual volumes defined in this pool. Total Random Read Cache Hits - Frontend The sum total of random frontend read I/Os on individual virtual volumes defined in this pool, which are serviced from the cache.
Table 39 Metrics and descriptions (continued) Metric category Metric Description Total Random Write Frontend The frontend I/Os for random write requests that result in cache hits, for all the snapshots in a snapshot pool. Total Sequential IO Frontend The frontend I/Os for sequential I/Os for all the snapshots in a snapshot pool. Total Sequential Reads Frontend The frontend I/Os for sequential read I/Os for all the snapshots in a snapshot pool.
Table 39 Metrics and descriptions (continued) Metric category Metric Description NOTE: This metric is disabled in the Alarm screen. Tier IOPS per Time Total number of I/Os on a pool tier over the collected monitoring cycles in a given duration. IO Buffer count Average value of the I/O buffer count in a sampling time for the selected MP Processor. NOTE: This metric is disabled in the Alarm screen.
Table 39 Metrics and descriptions (continued) Metric category Metric Description read from or written to the port in the last 30 seconds of the collection interval. Average Port MB – Frontend The average frontend throughput in MB/s that was read from or written to the port over an entire collection interval. Total MB – Frontend The total MB of all the LDEVs created in a specified RAID group for the given Host group over the entire data collection interval.
Table 39 Metrics and descriptions (continued) Metric category Metric Description ACP Random Read MB – Frontend The frontend throughput in MB/s read randomly from an ACP. ACP Random Write MB – Frontend The frontend throughput in MB/s written randomly to an ACP. ACP Total Sequential MB – Frontend The total frontend throughput in MB/s read from or written sequentially to an ACP. ACP Sequential Read MB – Frontend The frontend throughput in MB/s read sequentially from an ACP.
Table 39 Metrics and descriptions (continued) Metric category Metric Description Total Random MB – Frontend The sum total of random frontend I/Os throughput in MB/s transfer rate of all the virtual volumes in this pool. Total Random Read MB – Frontend The sum total of random frontend read I/Os throughput in MB/s transfer rate of all the virtual volumes in this pool.
Table 39 Metrics and descriptions (continued) Metric category Metric Description Total Sequential Write MB – The frontend throughput in Frontend MB/s data written sequentially to the external volume. Cache MB Metric Cache Usage MB The amount of cache used in MB. Cache Writes Pending MB The writes that are held in cache, yet to be transferred to the disks. Cache Sidefile Usage MB The size of the Continuous Access Asynchronous side file usage in MB.
Table 39 Metrics and descriptions (continued) Metric category Metric Description • ACP Left Util MP0 The utilization of the MP# on the left ACP. • ACP Left Util MP1 • ACP Left Util MP2 • ACP Left Util MP3 • ACP Left Util MP4 • ACP Left Util MP5 • ACP Left Util MP6 • ACP Left Util MP7 ACP Right Util Total The total utilization of the right ACP in the ACP pair. • ACP Right Util MP0 The utilization of the MP# on the right ACP.
Table 39 Metrics and descriptions (continued) Metric category Metric Description RAID Group Utilization Random Write Parity The utilization of the RAID group for writing random parity. RAID Group Utilization Seq Reads The utilization of the RAID group for sequential reads. RAID Group Utilization Seq Writes The utilization of the RAID group for sequential writes. RAID Group Utilization Seq Write Parity The utilization of the RAID group for writing sequential parity.
Table 39 Metrics and descriptions (continued) Metric category Metric Description MP Blade Util - Top 20 Consumers The average MP blade utilization by each of the 20 consumers over an entire collection interval. The top 20 consumers count is derived based on each consumer's average utilization of the CPU cycles. Used Capacity per Tier Used capacity of a pool tier over a collected monitoring cycles in a given duration.
Table 39 Metrics and descriptions (continued) Metric category Response Time Metrics Metric Description ACP Pair Write Tracks – Backend The total backend tracks destaged in sequential mode from the specified ACP Pair. ACP Pair Total Tracks – Backend The Overall backend transfers for the selected ACP pair. ThP Pool Backend Tracks Total backend tracks associated with a ThP pool. An aggregate of all the backend transfers as a result of I/Os occurring on every VVol in a ThP pool.
Table 39 Metrics and descriptions (continued) Metric category Metric Description the last 30 seconds of the collection interval. of all the LDEVS associated with the given host group. Average Read Response Time The average read response time of all the LDEVs created in a specified RAID group for the given Host group over the entire data collection interval.
Table 40 Real-time metrics definitions (continued) Real-time metrics Definitions Total KB per IO IO size Total random IOPS IO size Total random read hits IO size Total random read hit IOPS IO size Total random write IOPS IO size Total read IOPS IO size Total read KB per IO IO size for reads Total read through put KB per second IO size for reads Total seq IOPS IO size for reads Total seq read hits IO size for reads Total seq IOPS IO size for reads Total seq read IOPS IO size for read
Table 40 Real-time metrics definitions (continued) Real-time metrics Definitions Be - Total cache lines staged percentage Total backend reads percentage RG% Raid group utilization 404 Metric Category, metrics, and descriptions
F Appendix F Forecasting ThP pool performance Guidelines for selecting data range to receive an optimal forecast To validate the forecasted data, we need to understand the trend of the existing data, as the forecasted data is an extension of the existing trend. The forecasted data represents a trend of the ThP pool occupancy values and not the actual values. The following graph indicates the trend of the actual values. The forecasted values be an extension of the trend of the selected data points.
Glossary A Array Control Processor (ACP) ACP is used in the XP disk arrays prior to the XP24000 Disk Array. With the introduction of the XP24000 Disk Array, the DKA has replaced ACP. The DKA is also applicable for the P9500/XP7 disk arrays. ACP handles the transfer of data between the cache and the physical drives held in the DKUs. The ACPs work in pairs, providing a total of eight SCSI buses. Each SCSI bus associated with one ACP is paired with a SCSI bus on the other ACP pair element.
Command View (CV) Replaced by the Command View Advanced Edition Suite Software. Command View AE (CV AE) The Command View Advanced Edition Suite Software replaces the XP Command View Software to manage the XP and XP7 disk arrays. Consistency Group ID (CTG) A Group ID which guarantees consistency in the sequence of asynchronous data transfers for a remote copy volume group.
F FC Fibre Channel. A network technology primarily used for storage networks. G Globally unique identifier (GUID) It is a special type of identifier used in the software applications to provide a unique reference number. The value is represented as a 32 hexadecimal character string, such as the {21EC2020-3AEA-1069-A2DD-08002B30309D} and usually stored as a 128 bit integer.
P HP XP7 Performance Advisor The HP XP7 Performance Advisor is a software product from HP for monitoring the XP and the XP7 storage subsystems. Primary Volume (PVOL) The PVOL (also seen with a hyphen as P-VOL) is the first of a paired volume set for any program product other than those used for the remote copy operations. R RAID group A group of disks configured to provide enhanced redundancy, performance, or both.
T Thin Provisioning (ThP, TP) Using the thin provisioning, you can operate with a global pool of LDEVs that are not assigned to a physical storage. The XP and the XP7 disk arrays add virtual capacity from the pool of LDEVs as and when the data is written, and only at that time is the physical capacity assigned to the LDEVs and used for storage purpose.
Index Symbols C 10 busiest back-end RAID groups, 209 10 busiest front-end LDEVs, 208 Cache IO Metric, 397 Cache logical partitions (CLPRs), 357 Cache MB Metric, 397 changing database records, 91 Chart Style Line Plus Moving Average Chart Style, 287 Moving Average Chart Style, 286 Time Line Chart Style, 286 Time Line No Breaks Chart Style, 287 Charts Adding charts, 230 Favorite charts, 230 Saving charts, 230 Working with, 386 charts configuring metrics, 230 displaying data, 230 displaying different rates,
Chart Work Area High watermark, 105 LDEV Information Busiest LDEVs, 105 Statistics Frontend, Cache, Backend, 105 XP Array health Normal, Critical, Major, 105 Data Grid Update screen, 89 Database Archive data, 141 Backup utility, 141 Configure, 141 ExportDB, 141 Import data, 141 Purge, 141 database changing records, 91 configuring size, 145 purging, 146 Database Configuration Auto Grow, 143 Auto purging, 147 Database screen, 141 disk space requirements, 170 Displaying Authorized groups, 93 Authorized users,
P XP/XP7 array serial number Capacity Meter based Term license, 16 P9500 disk array, 16 XP7 Command View AE Coexistence, 10 P9500/XP7 disk arrays Real-time monitoring Host agents, CMDs, 317 SVP registration Outband collection, 72 PA installation Instant-on Grace period, 16 Performance data Automatic updates, 62 Collecting, 58 creating, 62 Delete schedule, 68 Edit schedule, 68 RAID groups, ports, 62 Restart schedule, 68 viewing, 62 performance data displaying, 214 displaying charts, 230 purging, 146 Perform
Utilization Status DKA, MP, RAID group, Cache write pending, 332 utilization metrics, 397 V View/Generate Reports logging report details and exceptions, 310 W websites HP , 355 HP Subscriber's choice for business, 354 X XP array CLPR utilization, Cache, 184 XP array serial number Capacity Permanent, 16 XP disk array, XP7 disk array, 16 XP disk arrays Real-time monitoring Host agents, CMDs, 317 SVP registration Outband collection, 72 414 Index