
HP StorageWorks XP Performance Advisor Software v4.6 User and Troubleshooting Guide (T1789-96094, June 2010)


Forecasting THP pools performance
Guidelines for selecting data range to receive an optimal forecast
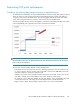
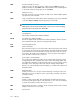
To validate the forecasted data, we need to understand the trend of the existing data, as the forecasted
data is an extension of the existing trend. The forecasted data represents a trend of the THP pool
occupancy values and not the actual values. The following graph indicates the trend of the actual
values. The forecasted values be an extension of the trend of the selected data points.
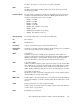
The following graph indicates the forecasted graph in red. The forecasted data starts below the actual
value and gradually grows upwards, based on the trend of the actual data.
NOTE:
XP Performance Advisor does not plot the trend as part of the charts. The trend shown in the preceding
figure is only for your reference.
The accuracy of the forecasting depends on the following factors:
• Data range size: The accuracy of the forecast is directly proportional to the size of data chosen.
So, select a range as large as possible. HP recommends to have at least 100 data points for XP
Performance Advisor to project an optimal forecast.
• End date of the selection: The end date should be near to the current date. If some of the recent
past data is omitted, the forecasted data not account for variances in that interval.
• No variance: Select a data range that has at least some variance. If the selected data range has
constant values for most of the range, the forecast may follow the constant data pattern.
• Empty collection ranges: Missing data points may induce error in the forecasted data.
HP StorageWorks XP Performance Advisor Software User Guide 371