
HP StorageWorks XP Performance Advisor Software v4.6 User and Troubleshooting Guide (T1789-96094, June 2010)
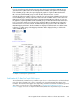
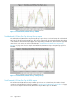
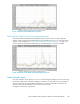
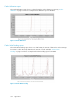
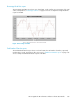
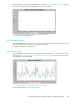
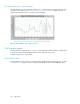
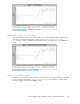
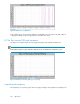

Figure 34 Total Frontend I/O Rate First Top 8 Ldevs
.
Total Frontend I/O Rate First Top 8 Array Groups/Pools report
The Total Frontend I/O Rate First Top 8 Array Groups/Pools report shows in a chart format, the
number of IO/s operations performed by the 8 busiest Array Groups/Pools. Pools can either be the
THP pool or the Snapshot pool. “Total Frontend I/O Rate First Top 8 Array Groups” on page 333
shows a sample Total Frontend I/O Rate First Top 8 Array Groups/Pools report for XP1024.
Figure 35 Total Frontend I/O Rate First Top 8 Array Groups/Pools
.
Cache utilization reports
The cache utilization reports allow you to view in a chart format, the utilization of cache in the array,
the amount of data in the cache that is waiting to be written to a disk, read hits as a percentage of
total read operations, the total number of transfers per second, the total number of transfers over
24-hours, cache side file utilization for XP Continuous Access Async.
A sample of each report is given below:
HP StorageWorks XP Performance Advisor Software User Guide 333