
HP StorageWorks XP Performance Advisor Software v4.6 User and Troubleshooting Guide (T1789-96094, June 2010)
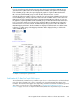
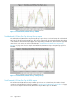
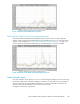
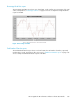
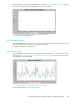
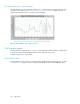
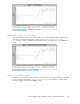
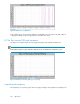

Figure 32 Total Backend I/O Rate First Top 8 LDEVs
.
Total Backend I/O Rate First Top 8 Array Groups report
The Total Backend I/O Rate First Top 8 Array Groups report shows in a chart format, the real backend
IO/s rate for the busiest 8 Array Groups. This can be compared to the potential maximum throughput
of the hardware. The maximum throughput varies depending on RAID level, disk mechanism type and
other factors such as the size of the individual IO/s. “Total Backend I/O Rate First Top 8 Array
Groups” on page 332 shows a sample Total Backend I/O Rate First Top 8 Array Groups report for
XP1024.
Figure 33 Total Backend I/O Rate First Top 8 Array Groups
.
Total Frontend I/O Rate First Top 8 LDEVs report
The Total Frontend I/O Rate First Top 8 LDEVs report shows in a chart format, the number of IO/s
operations performed by the first busiest 8 LDEVs. “Total Frontend I/O Rate First Top 8 Ldevs” on page
333 shows a sample Total Frontend I/O Rate First Top 8 LDEVs report for XP1024.
Appendix B332