
HP StorageWorks XP Performance Advisor Software v4.6 User and Troubleshooting Guide (T1789-96094, June 2010)

IMPORTANT:
If you do not select any value from the respective drop-down lists, by default, the LDEV IO report is
generated for the eight busiest front end and eight back end LDEVs, and eight front end and eight
back end RAID groups. Further, the report displays the graphs for only those LDEVs that have the
IO/s associated and the RAID groups on which the IO/s transactions have occurred.
Consider the following example: A report is created to view 32 busiest front end LDEVs and 16 busiest
front end RAID groups, and only eight of the selected 32 front end LDEVs and four of the selected 16
RAID groups are busy. XP Performance Advisor generates the LDEV IO report wherein you can view
the graphs for only the eight LDEVs and the four RAID groups on which the maximum IO/s transactions
have occurred. The graphs are not shown for the remaining LDEVs or the RAID groups as the IO/s
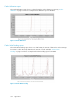
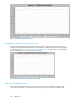
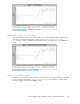
transactions have not occurred on them. The LDEV IO report also provides a link to the additional
LDEV IO mapping information. The busiest LDEVs are displayed at different ranks in a tabular format.
Following is a sample image of the mapping information that is displayed when you click the link
within a LDEV IO report:
A sample of each report is given below:
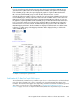
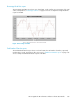
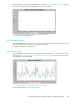
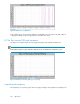
Total Backend I/O Rate First Top 8 LDEVs report
The Total Backend I/O Rate First Top 8 LDEVs report shows in a chart format, the real backend IO/s
rate of the busiest 8 LDEVs. This can be compared to the potential maximum throughput of the
hardware. The maximum throughput varies depending on RAID level and disk mechanism type and
other factors such as the size of the individual IO/s. “Total Backend I/O Rate First Top 8
LDEVs” on page 332 shows a sample Total Backend I/O Rate First Top 8 LDEVs report for XP1024.
HP StorageWorks XP Performance Advisor Software User Guide 331