
HP StorageWorks XP Performance Advisor Software v4.6 User and Troubleshooting Guide (T1789-96094, June 2010)

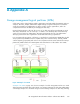
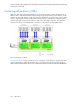
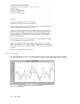
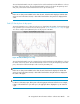
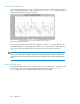
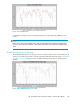
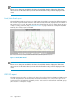

Figure 29 Read/Write Ratio
.
For example, the data point of X on the graph indicates X% read activity and (100-X)% of write
activity.
NOTE:
If there are no data points available for the dates selected, blank chart be displayed. If all the data
values are zero for the dates selected, a chart with a horizontal line along X axis be displayed in the
center.
Read/Write Ratio by hour of day report
The Read/Write Ratio by hour of day report shows in a chart format, the ratio of read activity to write
activity, over a 24 hour period. This is for both sequential and random read/write activity. “Read/Write
Ratio by hour of day” on page 329 shows a sample Read/Write Ratio by hour of day report for
XP1024.
Figure 30 Read/Write Ratio by hour of day
.
HP StorageWorks XP Performance Advisor Software User Guide 329