
HP StorageWorks XP Performance Advisor Software v4.6 User and Troubleshooting Guide (T1789-96094, June 2010)

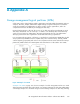
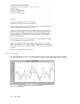

The total backend transfers may be compared to the total frontend IO/s and the difference is due to
the effects of the array cache. The total backend transfers load is borne by the Array Groups and
ACP pairs, whereas the total frontend IO load is borne by the CHIP ports.
NOTE:
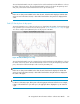
If there are no data points available for the dates selected, a blank chart be displayed. If all the data
values are zero for the dates selected, a chart with a horizontal line along X axis be displayed in the
center.
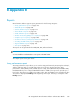
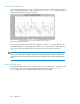
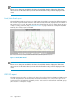
Total I/O Rate by hour of day report
The Total I/O Rate by hour of day report shows in a chart format, the number of total read and write
IO/s operations per second over the over 24-hour period. “Total I/O Rate by hour of day” on page
327 shows a sample Total I/O Rate by hour of day report for XP1024.
Figure 27 Total I/O Rate by hour of day
.
The total backend transfers may be compared to the total frontend IO/s and the difference is due to
the effects of the array cache. The total backend IO/s load is borne by the Array Groups and ACP
pairs, whereas the total frontend IO/s load is borne by the CHIP ports.
NOTE:
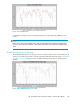
If there are no data points available for the dates selected, blank chart be displayed. If all the data
values are zero for the dates selected, a chart with a horizontal line along the X axis be displayed in
the center of the graph.
IMPORTANT:
For the Hour of the Day report, all the points collected aggregate to the start of the hour. For example,
if data is collected between 1 p.m. and 2 p.m., the aggregate data is displayed at 1 p.m. instead of
2 p.m.
HP StorageWorks XP Performance Advisor Software User Guide 327