
HP StorageWorks XP Performance Advisor Software v4.6 User and Troubleshooting Guide (T1789-96094, June 2010)

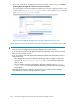


7. Enter your user name, password, and click Login.
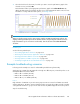
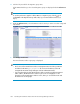
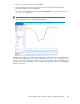
The Frontend IO Metrics chart window appears in the Chart Work Area displaying the
performance graphs for the selected LDEVs.
You can also select additional metrics from the Choose Metrics box. For more information, see
“Plotting charts” on page 213.
NOTE:
Once you login, the session is valid for the next 24 hours.
In addition to the LDEVs, you can also view the performance graphs of the other associated resources,
such as frontend, backend resources. For more information, see “Plotting charts” on page 213. You
can also use the other XP Performance Advisor screens to perform tasks, such as generating reports,
viewing events. For more information on the functionality and related procedures, see the individual
chapters in this guide.
HP StorageWorks XP Performance Advisor Software User Guide 299