
HP StorageWorks XP Performance Advisor Software v4.6 User and Troubleshooting Guide (T1789-96094, June 2010)

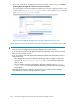


3. Select the check box for the metric, for which you want to view the performance graph of the
selected resources, and click OK.
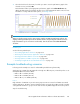
XP Performance Advisor plots appropriate performance graphs in the Chart Work Area. By
default, the data points are plotted for the last 1 hour of the management station's time. For more
information on using charts and chart options, see Plotting charts.
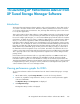
NOTE:
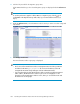
When you plot the average read or write response graph for an LDEV, XP Performance Advisor also
displays a table by default that provides the duration and the corresponding date when the load was
high on the LDEV. If you do not want to view the table, clear the selection for the Show Peak Load
check box.
Related Topics
See the following related topics:
• “Associating applications with hosts” on page 278
• “Removing association between application and hosts” on page 282
• “Viewing performance data for resources” on page 284
• “Viewing variations in LDEVs response time” on page 289
• “Searching for applications associated with resources” on page 283
Example troubleshooting scenarios
Following are the example use cases for understanding troubleshooting functionality:
Application has 3 LDEVs from XP mapped to it through two different ports (1A and 5A). There is one
CLPR (CLPR10) that hosts these LDEVs:
• LDEV 1: RG 1-1: RAID1 (2D+2D)
• LDEV 2: RG 1-2: RAID5 (3D+1D)
• LDEV 3: RG 2-1, 2-2: RAID5 (14D+2P)
Issue 1
High utilization of CHA MP on port 5A causing response time to increase for all LDEVs associated
with the application. The MP in question manages another port (7A) whose IOPS are high in number
causing the MP utilization to go up. Port 7A does not have any LDEVs mapped to the host in question.
Steps for troubleshooting:
HP StorageWorks XP Performance Advisor Software User Guide 291