
HP StorageWorks XP Performance Advisor Software v4.6 User and Troubleshooting Guide (T1789-96094, June 2010)
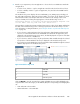
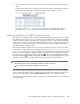

The reference value used by XP Performance Advisor is displayed as a blue straight line in the LDEV
average read and write response time graph.
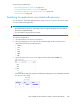
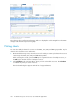
Plotting charts
You can select and plot charts for resources in the LDEVs, Port, CLPR, and RAID group tables. To plot
charts for the selected resources and metrics:
1. On the Troubleshooting screen, select the resources for which you want to plot charts. The resources
can belong to the LDEV, Port, CLPR, and RAID Group tables.
While selecting the records, press the Shift key for sequential selection of multiple resources, or
the Ctrl key for random selection of multiple resources.
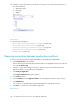
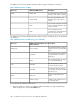
2. Click Plot Chart in the respective tables, where you have selected the resources. The Plot Chart
is enabled only when you select a resource.
The Plot Chart dialog box appears with the list of supported metrics.
Troubleshooting issues for resources associated with applications290