
HP StorageWorks XP Performance Advisor Software v4.6 User and Troubleshooting Guide (T1789-96094, June 2010)
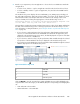
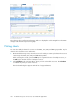

2. Select the check box for the metrics for which you want to view related resource performance
data.
The performance data of resources pertaining to the selected metric is displayed as a separate
column in the LDEV, Port, CLPR, or RAID Group table for which the metric is chosen.
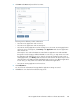
In the above figure, the Seq Reads metric is selected. The performance data of resources
pertaining to Seq Reads is displayed in a separate column, in the RAID Group table.
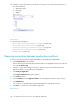
Viewing variations in LDEVs response time
Consider that your application has association with multiple LDEVs and is experiencing slow response
time. Because some of the resources, such as RAID group and CHIP MP are shared, their utilization
might not indicate an impact on the application in question. Instead, you can identify the LDEV that
is experiencing variations in its response time by analyzing the LDEV's read and write response time
values. Then, you can verify the utilization of associated resources, such as CHIP MP, RAID group,
and DKA to take the appropriate action.
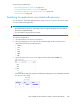
XP Performance Advisor analyses the previous average read and write response values of an LDEV
for the duration you specified in the User Settings screen (see “Setting the duration to predict the LDEV
response time” on page 83). It computes a reference value based on the actual data for the specified
duration and verifies whether the average read and write response values of an LDEV are beyond
the reference value. If the values are high, it displays a for the corresponding LDEV in the LDEV
table. On clicking the , the LDEV average read and write response time graph appears, the graph
displays the variations in the average read and write response time of the selected LDEV.
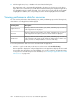
NOTE:
• The reference value used by XP Performance Advisor cannot be configured.
• corresponds to Avg Read/Write Response Time Variations
XP Performance Advisor also displays the duration when the variations were observed. The durations
and the corresponding dates when the load was high on the LDEVs are displayed in a table. If you
do not want to view the table, clear the Show Peak Load check box in the Chart Work Area.
You can view performance graphs related to other metrics and analyze the cause for the performance
load on the LDEVs.
HP StorageWorks XP Performance Advisor Software User Guide 289