
HP StorageWorks XP Performance Advisor Software v4.6 User and Troubleshooting Guide (T1789-96094, June 2010)
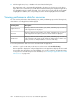
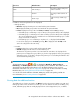

DescriptionDefault metricsResources
Percentage of data pending to be
written to an LDEV.
Write Pending %CLPRs
Percentage of data read from an
LDEV.
Read Hit
Total Percentage of CLPR usage
data.
Cache Usage
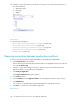
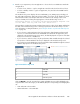
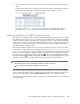
In addition, the following details are also displayed:
• RAID group table:
• DKA Pair: Displays the DKA pair associated with the particular LDEV.
• RG: Displays the RAID group number associated with the particular LDEV.
• Pool ID: Displays the ThP pool ID. In XP24000, XP20000, and SVS200 type arrays:
• If the RAID group is contributing to only one ThP pool, the respective ThP pool ID is displayed.
• If the RAID group is contributing to more than one ThP pool, the first ThP pool ID is displayed.
The corresponding RAID group is marked with * to indicate that the RAID group is contrib-
uting to more than one ThP pool.
• If the RAID group is not contributing to any ThP pool, – is displayed under Pool ID.
In case of XP arrays prior to XP24000 type array, NA is displayed under Pool ID, as ThP
cannot be configured in these XP arrays.
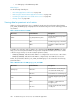
• Port table:
• Port ID: Displays the port associated with the particular LDEV.
• CHA MP: Displays the MP that is associated with the port.
The details of the partner port that is associated with the same MP is also displayed. The
partner port record appears in grey. When you plot the usage graphs for these ports (primary
and partner ports), you be able to analyze if the partner port is overloading the MP that is also
associated with the primary port.
NOTE:
The appropriate status icons ( , , or ) are displayed for MP Util (%), Write Pending (%),
DKA Util (%), and RG Util (%) based on the corresponding resource utilization. These status icons are
derived based on the threshold values that you set on the Threshold Settings screen. For more
information on the status icons, see “XP array health” on page 107. For more information on setting
threshold values, see “Setting performance threshold limits” on page 102.
You can also forecast the utilization of the DKA, RAID group, Cache write pending, and MP. For
more information, see “Forecasting utilization” on page 250.
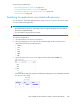
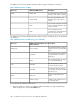
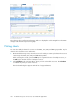
Viewing data for additional metrics
The additional set of metrics are listed in the Metrics list above the respective LDEV, Port, CLPR, and
RAID groups tables. These are metrics for which you can view data for the same set of LDEVs, ports,
CLPRs, and RAID groups that are initially displayed for the selected application, host, or WWN.
HP StorageWorks XP Performance Advisor Software User Guide 287