
HP StorageWorks XP Performance Advisor Software v4.6 User and Troubleshooting Guide (T1789-96094, June 2010)

• 1–1 RAID group in the RAID Group table
Related Topics
See the following related topics:
• “Associating applications with hosts” on page 278
• “Removing association between application and hosts” on page 282
• “Searching for applications associated with resources” on page 283
• “Plotting charts” on page 290
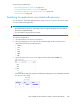
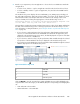
Viewing data for prominent set of metrics
When you select an application, host, or WWN for an XP array, the performance data of LDEVs,
ports, CLPRs, and RAID groups is displayed on the Troubleshooting screen for the following prominent
set of metrics.
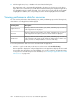
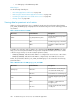
Table 6 Prominent metrics for LDEVs
DescriptionDefault metricsResources
Average Read and Average Write
Response time.
Avg Read/Write Resp TimeLDEVs
Total IO/s happening on the LDEVs.IOPS
Total MB/s of data written to the
LDEVs.
MBPS
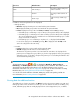
In addition, the replication status for LDEVs is also displayed under Replication Attribute. This data
helps you to know if a particular LDEV is being used as a replication volume (Cont. Access volume
or Business Copy volume). For are the example replication statuses:
• SMPL(CA)/SMPL(BC): Indicates that the LDEV is not configured as a Cont. Access or BC volume.
• PVOL(CA)/SMPL(BC): Indicates that the LDEV is configured only as a PVOL for Cont. Access.
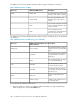
Further, the performance data for ports, CLPRs, and RAID groups is also retrieved for the following
prominent metrics.
Table 7 Default metrics for RAID groups, ports, and CLPRs
DescriptionDefault metricsResources
Total utilization of each DKA pair
associated with a RAID group.
DKA Util %RAID groups
Total utilization of each RAID group.RG Util %
Total IO/s happening through the
ports.
IOPSPorts
Total MB/s of data transferred
through the ports.
MBPS
Average of individual MP utilization
on each port.
MP Util %
Troubleshooting issues for resources associated with applications286