
HP StorageWorks XP Performance Advisor Software v4.6 User and Troubleshooting Guide (T1789-96094, June 2010)

IMPORTANT:
If you do not select any value from the respective lists, by default, the LDEV IO report is generated
for the eight busiest front end, eight back end LDEVs, eight front end, and eight back end RAID groups.
Further, the report displays the graphs for only those LDEVs that have the IO/s associated and the
RAID groups on which the IO/s transactions have occurred.
For example, if you have created a report to view 32 busiest front end LDEVs and 16 busiest front
end RAID groups, and only eight of the selected 32 front end LDEVs and four of the selected 16 RAID
groups are busy. XP Performance Advisor generates the LDEV IO report wherein you can view the
graphs for only the eight LDEVs and the four RAID groups on which the maximum IO/s transactions
have occurred. The graphs are not shown for the remaining LDEVs or the RAID groups, as the IO/s
transactions have not occurred on them. The LDEV IO report also provides a link to the additional
LDEV IO mapping information. The busiest LDEVs are displayed at different ranks in a tabular format.
For more information, see “LDEV IO reports” on page 330.
To generate or schedule an LDEV IO report, follow the procedure given for creating or scheduling a
report. For more information, see “Generating, saving, or scheduling reports” on page 260. In addition,
ensure that the following steps specific to an LDEV IO report are also complete:
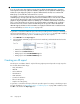
1. Select LDEV IO from the Report Type list.
2. Select the LDEVs and RAID groups based on the frontend IO/s and backend transfers from the
following lists:
• LDEVs from the FrontEnd Ldevs list
• LDEVs from the BackEnd Ldevs list
• RAID groups from the FrontEnd RAIDGroups list
• RAID groups from the BackEnd RAIDGroups list
Creating an All report
The All report consolidates data for only the following eight reports and provides a single report for
the selected date and time range:
• Array Performance
• LDEV IO
• Cache Utilization
• ACP Utilization
• CHIP Utilization
• Journal Pool Utilization
• ThP Pool Occupancy
• Snapshot Pool Occupancy
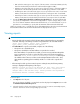
To generate or schedule an All report, follow the procedure given for creating or scheduling a report.
For more information, see “Generating, saving, or scheduling reports” on page 260. In addition, ensure
that All is selected from the Report Type list.
Using reports266