
HP StorageWorks XP Performance Advisor Software v4.6 User and Troubleshooting Guide (T1789-96094, June 2010)

IMPORTANT:
• Reports on the following are available only if they are configured in the selected XP array. If these
resources are not configured, they are not even displayed as an option that you can select while
creating a report. Hence, they are not even displayed in other related reports, like the Array Per-
formance report.
• Journal pool utilization
• ThP pool occupancy
• Snapshot pool occupancy
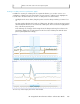
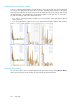
• XP Performance Advisor plots the data for eight resources on a chart in the report that you execute.
If there are more than eight resources to chart, XP Performance Advisor plots the data for the next
set of eight resources in the subsequent chart, and so on. For example, if you want to view a report
for 64 busiest LDEVs, XP Performance Advisor generates a report in which you can view eight
charts, each chart accommodate eight LDEVs.
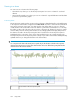
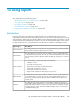
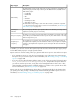
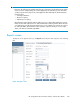
Reports screen
The Reports screen appears when you click Reports in the left pane and comprises of the following
tabs:
Figure 21 Reports screen
.
HP StorageWorks XP Performance Advisor Software User Guide 259