
HP StorageWorks XP Performance Advisor Software v4.6 User and Troubleshooting Guide (T1789-96094, June 2010)

12 Using reports
This chapter discusses the following topics:
• “Generating, saving, or scheduling reports” on page 260
• “Viewing a report” on page 268
• “Viewing a schedule” on page 270
• “Virtualization for reports” on page 269
• “Logging report details and exceptions” on page 272
Introduction
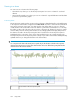
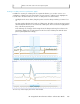
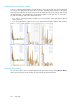
Reports provide history of performance data collected for a specified XP array, where a visual
representation of the performance trend of XP array resources is shown for a duration that you specify.
The performance data points are plotted for different metrics that help analyze performance of an XP
array. Following are the different reports that you can view in XP Performance Advisor. These reports
provide a high level view on the performance of an XP array or utilization of individual resources:
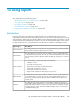
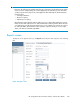
DescriptionReport types
The array performance report provides the array performance by measuring the total
IO/s, read and write IO/s happening on the XP array.
Array Performance
The ACP utilization report provides data on utilization of various installed ACP pairs
for the duration that you specify. You can also view the ACP Utilization by Hour of the
Day report that provides the utilization data for all ACP pairs averaged over a 24-hour
period.
ACP utilization
The cache utilization report provides data on the following:
• Utilization of cache
• Percentage of pending writes
• Read hits as a percentage of total read operations
• Total number of transfers per second
• Total number of transfers over 24-hours
• Cache side file utilization for XP Continuous Access Async
Cache utilization
The CHIP utilization report provides data on utilization of various installed CHIP pairs
for the duration that you specify. You can also view the CHIP Utilization by Hour of
the Day report that provides the utilization data for all CHIP pairs averaged over a
24-hour period.
CHIP utilization
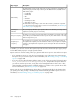
The LDEV IO report provides data on the busiest LDEVs and RAID groups based on
frontend IO/s, and backend transfers. You can select the number of busiest LDEVs and
RAID groups that you want to view in the report. The selection is in multiples of eight
and ranges from 8 - 128 for Frontend and Backend LDEVs, and 8 - 32 for Frontend
and Backend RAID groups.
LDEV IO
HP StorageWorks XP Performance Advisor Software User Guide 257