
HP StorageWorks XP Performance Advisor Software v4.6 User and Troubleshooting Guide (T1789-96094, June 2010)

Zooming in on charts
You can zoom in on charts in the following ways:
• Horizontal zoom, where you use the Zoom preview panel to zoom in on charts for a selected
duration
• Vertical and horizontal zoom, where you zoom in on charts for a specified duration and also data
points across performance graphs
Previewing charts
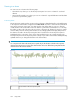
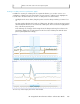
The Zoom preview panel provides a preview to the performance data displayed for a selected duration
in the respective chart window. It appears if the Show Zoom check box is selected in the Chart Work
Area, and occupies the lower pane of a chart window. It has sliders that you can use to filter the
overall duration in the chart window and view data for a particular focused duration. You can drag
the sliders on either side of the time scale to increase or decrease the duration for which you want to
view the data points. The existing chart window are accordingly updated to display data points for
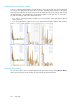
the duration selected in the Zoom preview panel. The focused area in the Zoom preview panel is
highlighted in blue. It shows the section of the chart window that you are currently viewing in the
Zoom preview panel. The Zoom preview panel is always in sync with its chart window and dynamically
updated whenever you change the duration in the chart window.
IMPORTANT:
You can preview the data in the Zoom preview panel only for the duration selected in the respective
chart window. The preview is for the entire chart window and covers all the data points plotted in the
chart window for the selected duration.
Focused area in the Zoom preview panel1
Using charts254