
HP StorageWorks XP Performance Advisor Software v4.6 User and Troubleshooting Guide (T1789-96094, June 2010)

IMPORTANT:
• HP recommends that you select minimum Point Factors for accuracy and better view of the graph
that is plotted.
• Moving Average is calculated as the average of the initial set of data points. Hence, the graph is
not displayed for the initial set of data points. The Point Factor that you select determines the
number of data points that are considered to calculate the Moving Average value.
• Chart displays a break in collection whenever there is a difference in frequency between the current
collection interval and the previous collection interval. For example, you might have set the current
collection interval at five minutes and the previous collection interval at three minutes, resulting in
a change in collection frequency. Thus, the graph displays a break in the plotting of data points,
implies a change in frequency between the previous and the current collection.
The Moving Average values are calculated and plotted only for those data points that are collected
by the data collection process. If the data collection fails, the Moving Average values are not calculated
and plotted on the graph. However, if the collection had not failed, a line displays connecting the
last data point that was plotted before the failure and the first data point that is plotted after the data
collection resumed. As a result, you can view a complete graph for the average performance of the
selected array resources irrespective of whether the data collection is active or discontinued. The
legend names for the Moving Average graphs are appended with -MA.
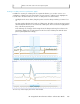
Line Plus Moving Average Chart Style
The Line Plus Moving Average chart style enables you to view the actual performance and the average
performance of the selected resources for a specified time interval. Both the Time Line and the Moving
Average chart styles are applied on the performance graphs for the selected resources. Separate
Legend items at the right hand corner of the chart window enable you to differentiate a Time Line
graph from a Moving Average graph.
If this chart style is selected along with appropriate point factor, the data points and the average
values are plotted simultaneously when the data collection is in progress. If the data collection fails
for a particular duration, two straight lines are displayed for that duration, indicating a failure in data
collection. The straight line for Time Line connects the last data point that was plotted before the failure
and the first data point that is plotted after the data collection resumed. The straight line for Moving
Average connects the last Moving Average value that was plotted before the failure, and the first
Moving Average value that is plotted after the data collection resumed. This provides you an
approximate idea of the actual and average performance trend if the collection had not failed. Once
the data collection resumes, the data points and the average values are again plotted simultaneously
for the selected resources.
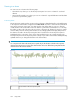
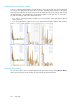
Time Line No Breaks Chart Style
The Time Line No Breaks chart style enables you to view the actual performance of the selected
resources irrespective of whether the data collection is active or discontinued. Using this style, you
can view a complete graph that includes the data points plotted when the data collection is active,
and the performance trend of the selected resources when the data collection is discontinued. From
the Time Line No Breaks graph, you can visualize the pattern in which the data points be plotted
irrespective of whether the data collection is active or discontinued.
The data points are plotted simultaneously when the data collection is in progress. If the data collection
fails for a particular duration, a straight line is displayed for that duration, indicating a failure in data
collection. The straight line joins the last data point that is plotted before the data collection failed
and the first data point that is plotted after the data collection resumed. This provides you an
approximate idea of the performance of the resources if the data collection was active during the
specified time interval. Once the data collection resumes, the data points are again plotted
simultaneously for the selected resources.
HP StorageWorks XP Performance Advisor Software User Guide 253