
HP StorageWorks XP Performance Advisor Software v4.6 User and Troubleshooting Guide (T1789-96094, June 2010)
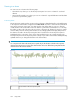
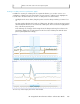
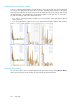
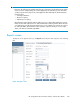
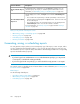
chart window. It is in addition to the data points that are already plotted for the specified date
and time range. All the other data points are shifted one column to the left of the graphs.
When you click Start Updating, the chart re-renders itself to show the new values that are collected
from the host agent. The Start Time shows the time when the automatic update started, and the
End Time displays Continuous Update, which means that XP Performance Advisor continuously
updates the chart with the newest data points till the time you click Stop Updating. Then, XP Per-
formance Advisor stops the automatic re-rendering of the chart. The End Time displays the time
till when the chart was last updated. By default, the performance graph is updated with new data
points every five minutes.
• Date/Time Filters:
Duration shows the following date filters:
• 1 hour
• 6 hours
• 12 hours
• 1 day
• 1 week
• ...: Click to select the duration (start and end date) from the calendar. The duration is for when
you want to view the performance data of the selected resources.
By default, the data points collected in the last one hour of the management station's time are
displayed, if you do not specify a particular duration.
• Last 10 Collections:
Click Last 10 Collections to view only the last 10 data points plotted in the graph.
Using chart Styles
Following are the different chart styles that you can use on the performance graphs in the Chart Work
Area:
• Time Line
• Moving Average
• Line Plus Moving Average
• Time Line No Breaks
Time Line Chart Style
Time Line chart style (default) enables you to view the plotting of data points for a fixed time interval.
In addition, when data points for multiple metrics are plotted with different collection frequencies,
their relationships with the time intervals are displayed correctly.
Only data points that are collected during the specified interval are retrieved from the database and
plotted on the graph. Data points are not plotted for intervals of time where data collection has failed.
Hence, there can be discontinuity in the graph plotted. In the sense, the graph for that particular
duration displays a blank graph area, indicating a failure in data collection. The data points are
plotted again once data collection resumes.
Moving Average Chart Style
The Moving Average chart style enables you to view the average performance of the selected resources
for a specified time interval. The current average (Moving Average) value is calculated by taking the
average of the previous data points. You can specify the number of data points for which the average
needs to be calculated, using the Point Factor list. The minimum that you can select from the Point
Factor list are 2 points and the maximum are 24 points.
Using charts252