
HP StorageWorks XP Performance Advisor Software v4.6 User and Troubleshooting Guide (T1789-96094, June 2010)
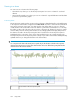
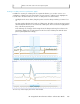
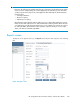

In the preceding utilization forecast graph, the threshold value is displayed as a blue reference line
and the forecast is shown as a green line.
IMPORTANT:
• The forecasting feature is available only for DKA, MP, RAID group, Cache, and ThP pool. However,
the utilization forecast is measured against the set threshold only for DKA, MP, RAID group, and
Cache.
• To forecast utilization for a week, HP recommends that there be a minimum of 250 data points
or the performance data has been collected for two or more days.
To forecast a ThP pool's utilization, XP Performance Advisor considers the ThP pool's existing rate of
utilization. Then, it extends the respective ThP pool's performance graph to project the corresponding
utilization for the next day, week, month, six months, or year, based the duration that you select. For
more information on forecasting for THP pools, see “Forecasting THP's performance” on page 371.
To forecast utilization for any of the above-mentioned resources, select the resource and its
corresponding metric, and select the duration from the Forecast list in the Chart Work Area. You can
forecast the utilization for only one resource at a time.
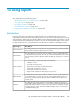
Using date and time filters
Following are the date and time filters that you can use on charts:
• Start Updating:
Click Start Updating for XP Performance Advisor to update the selected chart window with the
newest data points that gets added to the database after the specified end time. XP Performance
Advisor regularly checks the database for new data that gets added after the specified end time,
and if new data is found, the newest data points are added to the right side of the graphs in the
HP StorageWorks XP Performance Advisor Software User Guide 251