
HP StorageWorks XP Performance Advisor Software v4.6 User and Troubleshooting Guide (T1789-96094, June 2010)
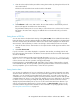
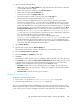

Printing charts
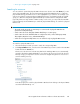
In the Chart Work Area, click Print to print the charts that belong to the selected chart windows. By
default, all the chart windows in the Chart Work Area are selected. They are printed as separate
pages and the local system printer configuration settings are considered while printing the charts.
However, if the charts that you want to print belong to chart windows that are not selected:
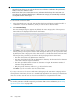
1. Click the title bars of those chart windows to select them (blue border should appear around the
chart window).
2. Click Print.
If you do not want to print a particular chart window, click the title bar of that chart window (the blue
border around the chart window should look disabled).
NOTE:
Only maximized chart windows that are selected can be printed.
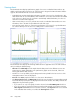
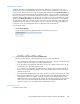
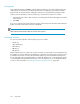
Forecasting utilization
You can forecast the utilization of the following resources in Charts:
• MP Util (%)
• Write Pending (%)
• DKA Util (%)
• RG Util (%)
• ThP Util (%)
The forecasting can be for a day, week, month, six months, or year based on the current data points.
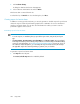
For example, if you have data points for RAID group collected over two days and you want to forecast
its utilization for the next one week, XP Performance Advisor forecasts the utilization rate based on
the two days data. The forecasted utilization of a DKA, MP, RAID group, or write pending for Cache
is measured against the default threshold values or the values that you set on the Threshold Settings
screen. For more information, see “Setting performance threshold limits” on page 102.
Using charts250