
HP StorageWorks XP Performance Advisor Software v4.6 User and Troubleshooting Guide (T1789-96094, June 2010)

Loading favorite charts
A favorite chart when selected displays the performance data points of resources for the current
duration that is active in the Chart Work Area. You can also view the performance of the selected
resources for a duration of your choice by selecting the date and time using the Date/Time Filter. The
favorite chart re-renders itself to provide the performance graphs of resources for the selected duration.
However, every time you view a favorite chart, the previous set of data points are not retained and
displayed along with the current set of data points. For example, if 6 hours is selected as the current
duration in the Date/Time Filter for the Chart Work Area, the favorite chart that you select displays
the performance data points collected over the last 6 hours only. The chart does not display the set
of data points previous to the 6 hours duration. If you do not specify a time range, the data points
for the last 1 hour of the management station are displayed in the chart window.
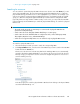
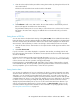
To view favorite charts:
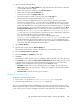
1. Click Load Fav Chart(s).
A pop up dialog appears displaying the favorites charts that you can view.
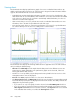
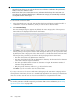
2. Select a favorite chart from the list and click View Chart.
The favorite chart appears in the Chart Work Area and is selected by default.
• You can add resources for metrics belonging to the same metric category to this favorite chart
and save it with the same name, or provide a different name.
• If you provide the existing favorite chart name, the new set of metrics and resources are ap-
pended to the list in the existing favorite chart.
• If you add resources and metrics for a different metric category, the performance graph of
the resources are automatically added in a new chart window and you should save it as a
separate favorite chart.
• If a chart window already exists for the metric category, for which you load a favorite chart,
the performance metrics for resources in the favorite chart is automatically appended to the
existing chart window. For example, if a chart window exists for Utilization metrics in the
Chart Work Area and you load a favorite chart for the same metric category, the performance
metrics of resources are automatically appended to the existing Utilization Metrics chart
window. If required, you can again save the updated favorite chart.
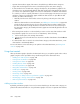
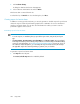
Deleting favorite charts
To delete a favorite chart:
HP StorageWorks XP Performance Advisor Software User Guide 247