
HP StorageWorks XP Performance Advisor Software v4.6 User and Troubleshooting Guide (T1789-96094, June 2010)
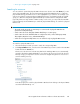

1. Clear the selection (blue border) around the existing chart window by clicking the title bar of the
active chart window.
The blue border around the chart window should look disabled.
2. Click Add New to add a new chart window. The new chart window is automatically selected
(blue border appears around the active chart window).
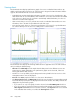
The performance data points of resources that you select in the Resource selection tree for metrics
belonging to the same metric category are added to the new chart window till you clear the
selection.
Saving charts as PDF files
You can save charts in the Chart Work Area by clicking Save as PDF, where individual chart windows
having the charts are saved as separate PDF files. By default, all the chart windows in the Chart Work
Area are selected. Hence, XP Performance Advisor saves all the charts displayed in the Chart Work
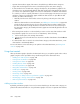
Area. However, if the charts that you want to save belong to chart windows that are not selected:
1. Click the title bars of those chart windows to select (blue border should appear around the chart
window).
2. Click Save Chart as PDF.
If you do not want to save charts displayed in a particular chart window, accordingly click the title
bar of the respective chart window to disable the selection (the blue border around the chart window
should look disabled).
Following is the file naming convention given to the PDF documents,<ChartTitle>_Timestamp.pdf,
where <ChartTitle> refers to the metric category title given for the chart window and Timestamp
refers to the time when the save operation was triggered (example,
Frontend_IO_Metric_1254653406958.pdf). Depending on the number of chart windows selected
in the Chart Work Area, the save operation opens the equivalent number of new browser windows.
You are prompted to open or save the PDF, or cancel the save operation.
Saving favorite charts
You can save the combination of resources and metrics for which you want to frequently view charts,
as favorite charts. Whenever you want to view the performance graphs for the same set of resources
and metrics, you can load the corresponding favorite chart. Hence, you need not select the same
combination of resources and metrics again to plot their performance metrics. Favorite charts provide
a template framework, where you can continuously append new resources and metrics to the existing
list. These resources can belong to multiple XP arrays. By default, a favorite chart when selected
displays the performance data points of resources for the current Chart Work Area duration. If you
want to view performance data points for a longer duration, use Date/Time Filter, where you can
select date and time range from the calendar. For more information on specifying duration of time,
see “Using date and time filters” on page 251.
HP StorageWorks XP Performance Advisor Software User Guide 245