
HP StorageWorks XP Performance Advisor Software v4.6 User and Troubleshooting Guide (T1789-96094, June 2010)
• Separate chart windows appear if the metrics selected belong to different metric categories.
• Single chart window appears if the metrics selected belong to the same metric category.
• If chart window for the selected metric category already exists, the performance graphs for the
selected resources are automatically added to that chart window in the Chart Work Area. However,
you can also view performance graphs of resources for related metrics in different chart windows.
It is useful if you want to compare performance of resources belonging to the same resource type
and metric category, by plotting their graphs in different chart windows. To plot different chart
windows, do either of the following:
• Manually clear the active chart window selection by clicking in the title pane of the chart
window.
• Add a new chart window. For more information, see “Adding new chart windows” on page 244.
In both the above mentioned cases, the new chart window takes precedence and becomes
the active chart window. Though the metrics selected for the next set of resources belongs to
the same metric category, the related performance graphs are automatically plotted in the new
chart window.
• If the existing chart window is not selected and you want to use the same chart window to add
the performance graph of a new resource for a related metric, do the following:
1. Click in the title pane of the existing chart window.
2. Choose the resources from the Resource selection tree and the related metrics from the Choose
Metrics box.
• If a chart window does not exist for the selected metric category in the Chart Work Area, a new
chart window is automatically added.
For more information on the tasks that you can perform in the Chart Work Area, see “Using chart
controls” on page 244.
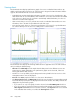
Using chart controls
After a performance graph is plotted in the Chart Work Area, you can perform specific tasks on those
graphs using the controls provided in the top and bottom pane of the Chart Work Area.
• “Adding new chart windows” on page 244
• “Saving charts as PDF files” on page 245
• “Saving favorite charts” on page 245
• “Loading favorite charts” on page 247
• “Forecasting utilization” on page 250
• “Using date and time filters” on page 251
• “Chart Styles” on page 252
• “Printing charts” on page 250
• “Previewing charts” on page 254
• “Zooming in on data points across performance graphs” on page 255
• “Rearranging or moving chart windows” on page 256
• “Removing chart windows” on page 256
Adding new chart windows
By default, performance graphs of resources for metrics that belong to the same metric category are
plotted in the same chart window. To view performance graphs of resources in separate chart windows:
Using charts244