
HP StorageWorks XP Performance Advisor Software v4.6 User and Troubleshooting Guide (T1789-96094, June 2010)

NOTE:
These selections work on only active chart windows.
Place the pointing device on a particular data point to view the following details:
• XP array to which the selected resource belongs
• Selected resource name
• Selected metric name
• Selected duration
• Current performance value
• Drive type information if the resource is a RAID group or LDEV
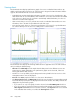
Individual Chart windows
When you select resources and associated metrics in the Resource selection tree under Charts, the
corresponding performance graphs are automatically plotted in the Chart Work Area. The chart
window that displays the performance graphs appears selected (active chart window). By default,
every chart window in the Chart Work Area appears selected. The title of the chart window indicates
the metric category for which the performance graphs are plotted. The number besides the metric
category in the title indicates the sequence in which the chart windows appear. You can also rearrange
and resize individual chart windows in the Chart Work Area.
An individual chart window can accommodate performance graphs of up to 250 resources. The 250
resources that you select can belong to multiple resource types and for different metrics that should
belong to the same metric category. Performance Advisor plots the performance graphs incrementally
and continues till the performance graphs for all the 250 resources are plotted in the chart window.
If you select more than 250 resources, the performance graphs for the remaining set of resources
(beyond 250) are plotted in the subsequent chart window that automatically appears in the Chart
Work Area. During the process of plotting performance graphs, the Loading charts...please
wait message is displayed on the bottom right corner of the Chart Work Area. You can click Stop
during the process to discontinue the plotting of performance graphs. Performance Advisor completes
the current request and then stops the plotting operation.
In addition, the following are also displayed in each chart window:
• Total number of resources for which performance graphs are plotted
• Individual legends in the Legends list. Each resource is given a unique color coding in the Legends
list that you can map to the corresponding data points plotted in the chart window. Click a legend
associated with a resource to hide or view its corresponding performance graph in the chart
window.
• Legends check box that you can select based on whether you want the legends list to appear in
the particular chart window. This action overrides the Show Legends check box selection in the
Chart Work Area.
NOTE:
Though the Legends check box is selected, the Legends list is displayed for only 30 resources. If
the display of legends cannot be accommodated in the given chart window dimension, a vertical
scroll bar appears for the Legends list.
Following are important notes on chart windows:
HP StorageWorks XP Performance Advisor Software User Guide 243