
HP StorageWorks XP Performance Advisor Software v4.6 User and Troubleshooting Guide (T1789-96094, June 2010)

Viewing charts
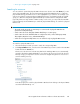
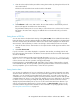
The Chart Work Area displays performance graphs of resources in individual chart windows. By
default, each chart window represents one of the five metric categories that XP Performance Advisor
supports. The Chart Work Area consists of the following:
• Individual chart windows that display performance graphs of resources for selected metrics. The
Chart Work Area can accommodate four chart windows in a row. New chart windows are added
to the next row, in which case, the scroll bar is automatically enabled and takes you to the row
where the new chart window appears.
• Chart controls that you can use to perform various tasks on individual chart windows. For more
information, refer to the tasks list provided at the end of this topic.
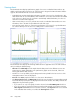
• Zoom preview panel, where you can preview performance of resources for a specified duration.
You can also directly zoom in across set of data points in a chart window.
The Chart Work Area displays the following default selections applicable across the chart windows
until you modify the default settings:
• Time Line in the Chart Style list. This implies that the data points for the different resources are
plotted as a line graph and breaks in the performance graphs can be observed, if there are
missing performance data collection.
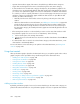
• Duration as 1 hour. By default, only the data points that are plotted for the last one hour of the
management station's time are displayed.
• Forecast shows None, implies that there is no forecast on ThP utilization.
• The Show Legends, Zoom, and Data points check boxes are selected. The corresponding Legends
list and the Zoom preview panel are displayed in all the chart windows. The data points are also
displayed in the performance graphs.
• If you want to see only a line graph, clear the selection for the Show Data points check box.
• If you do not want to view the Zoom preview panel and the Legends list, clear the respective
Show Legends and Zoom check box selections. However, if the Legends check box is selected
in the individual chart window, it overrides the Show Legends selection.
Using charts242