
HP StorageWorks XP Performance Advisor Software v4.6 User and Troubleshooting Guide (T1789-96094, June 2010)
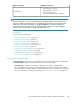

Default set of metricsBack-end category
• LDEV Total IO/s – Frontend
• LDEV Total MB/s – Frontend
• Average Read Response
• LDEV Sequential Read Tracks – Backend
Physical LDEVs
NOTE:
There are other metrics to choose for both RAID groups and physical LDEVs in the following metric
categories available: Frontend IO metrics, Frontend MB metrics, Backend metrics, Utilization metrics,
and Response Time metrics. Click more... in the Choose Metrics box. The metrics displayed are
categorized based on the metric category to which they belong. Select a metric and click Done to
view the corresponding performance graph in the Chart Work Area.
Related Topics
See the following related topics:
• “Front-end navigation path” on page 221
• “Cache navigation path” on page 223
• “Back-end navigation path” on page 224
• “ThP Pool navigation path” on page 227
• “Snapshot Pool navigation path” on page 229
• “LUSE navigation path” on page 233
• “Replication Volumes navigation path” on page 231
• “Host Groups navigation path” on page 234
• “Ext-RAID Groups navigation path” on page 236
• “Custom groups navigation path” on page 239
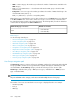
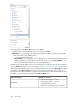
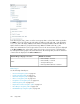
Custom groups navigation path
The Custom Groups node comprises of individual custom groups that display the associated LDEVs.
The Custom Groups category includes the following resource selection path:
• Custom Groups > Individual custom group > LDEVs (resource type) > Individual LDEVs
The serial numbers of the XP arrays to which the LDEVs belong are also mentioned in brackets
beside the LDEV IDs. Multiple LDEVs from different XP arrays can be grouped as a custom group.
For more information on creating custom groups, see “Creating custom groups” on page 84.
HP StorageWorks XP Performance Advisor Software User Guide 239