
HP StorageWorks XP Performance Advisor Software v4.6 User and Troubleshooting Guide (T1789-96094, June 2010)

to view the LDEV main category under which all the associated LDEVs are displayed. For more
information on creating custom groups, see “Creating custom groups” on page 84.
Based on your requirement, you can select resources belonging to different custom groups and XP
arrays. Accordingly, related metrics are displayed in the Choose Metrics box. Select a metric and
view the performance graphs of resources in the Chart Work Area.
Choosing metrics
When you choose an XP array, individual resources, or resource types in the Resource selection tree,
a default set of related metrics are displayed for selection in the Choose Metrics box. The set of metrics
displayed vary based on what you choose in the Resource selection tree. These metrics can belong
to different metric categories and only those metrics applicable to the selected set of resources are
displayed.
• Related metrics are displayed in the Choose Metrics box, if you select a homogeneous set of re-
sources, where the selected resources belong to the same resource type within or across XP arrays.
Related metrics can belong to different metric categories. For example, only LDEV related metrics
are displayed in the Choose Metrics box, if you choose Physical LDEVs under Back-end > RAID
Groups.
• Common set of metrics are displayed in the Choose Metrics box, if you select a heterogeneous set
of resources, where the selected resources belong to different resource types within or across XP
arrays. If the selected resources do not have common metrics, only the metrics for the latest selected
resource are displayed in the Choose Metrics box. For example, if you select CLPR0 and RAID
group 1–1, only metrics related to the selected RAID group 1–1 are displayed in the Choose
Metrics box.
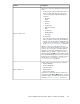
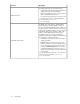
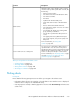
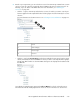
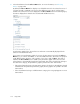
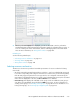
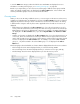
The following figure shows the default set of metrics that are displayed based on the resource selection:
• The first image shows the metrics displayed when you select the XP array, 82502
• The second image shows the metrics displayed when you select the resource type, CHA (4)
• The third image shows the metrics displayed when you select the resource, CL1A
Using charts220