
HP StorageWorks XP Performance Advisor Software v4.6 User and Troubleshooting Guide (T1789-96094, June 2010)
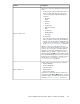
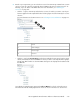

DescriptionXP array main categories – Resource selection
tree
Comprises of individual host groups that display the
associated ports. Each port further displays the
associated LDEVs. For more information, see “Host
Groups navigation path” on page 234.
Host Groups
Comprises of external RAID groups that are managed
by your XP array. For more information, see “Ext-RAID
Groups navigation path” on page 236.
Ext-RAID Groups
Comprises of individual drive types that are available
on the selected XP Disk Array, and the RAID groups
for each of the drive types. The RAID groups further
display the list of associated physical LDEVs. For more
information, see “Drive types navigation
path” on page 237.
Drive Types
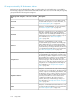
The above categorization helps you view the overall performance of an XP array through various
channels of selection. For example, if your application response time is high, following is one of the
ways to identify the issue in the XP array that is processing your application requests:
1. For all the CHA boards, plot the MP utilization and identify the MP with high utilization.
2. For that particular MP, plot the performance graphs of ports (Front-end > CHA > MP > Port) to
identify the port that is doing maximum IO/s.
3. For that port, identify the associated host (Host Groups > Host > Ports).
4. For that host, plot performance graphs of all the LDEVs and identify the LDEV that is contributing
to the observed high response time.
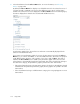
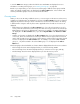
Click the + sign for a main category to navigate through the associated resources and view their
performance graphs for selected metrics. Resources of the same type are grouped together and each
such resource further expands to a subset of resources depending on its level of hierarchy in the
Resource selection tree. For example, the hierarchy of resource selection for an XP array under
Front-end is as follows: Front-end > CHAs > MPs > Ports.
• Front-end is the main category that displays the set of CHAs grouped under the resource type,
CHA.
• Each CHA displays only the set of MPs on that CHA under the resource type, MP.
• Each MP further displays only the set of associated ports under the resource type, Ports.
This logical grouping of resources enables easy navigation through different levels of resource types
to select and view performance graphs of specific resources. For example, ports are categorized
under MPs, so that you can easily identify a port that belongs to a particular MP. If you notice that
the utilization of a particular MP on an XP array is high, you can easily drill down to the associated
ports to view their performance metrics for the duration when the MP utilization was found high. Based
on your requirement, you can select resources belonging to different resource types under different
categories for multiple XP arrays, and view their performance graphs for related metrics in the Chart
Work Area.
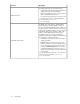
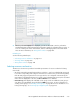
Custom Groups
Custom Groups displays the individual custom groups you created. These custom groups have group
of LDEVs that you want to monitor frequently. Click an individual custom group under Custom Groups
HP StorageWorks XP Performance Advisor Software User Guide 219