
HP StorageWorks XP Performance Advisor Software v4.6 User and Troubleshooting Guide (T1789-96094, June 2010)
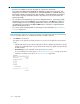
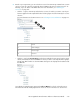

4. After the performance graphs are displayed, you can use the Chart controls to perform the
intended tasks that include previewing the performance graphs for a duration that you select, or
zoom in on data points in the chart window, and also rearranging charts in the Chart Work
Area. For more information, see “Using chart controls” on page 244.
Related Topics
See the following related topics:
• “Selecting resources and metrics” on page 217
• “Viewing charts” on page 242
• “Using chart controls” on page 244
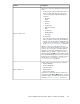
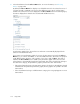
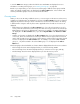
Selecting resources and metrics
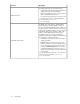
The Resource selection tree provides a hierarchal representation of resources under the following
main nodes:
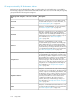
• XP arrays monitored by XP Performance Advisor. Click the + sign for an individual XP array node
to view the corresponding main categories in the Resource selection tree (see the following table).
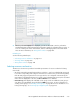
If the XP array supports a particular resource type and it is not configured on the XP array, the
main category is displayed in the Resource selection tree for that XP array. However, the associated
metrics are not displayed for selection, the Choose Metrics box is disabled.
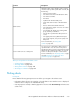
• Custom Groups, that displays the individual custom groups. Click an individual custom group to
view all the associated LDEVs grouped under the LDEV resource type. For more information on
creating custom groups, see “Creating custom groups” on page 84. For more information on se-
lecting custom groups, see “Custom groups navigation path” on page 239.
HP StorageWorks XP Performance Advisor Software User Guide 217