
HP StorageWorks XP Performance Advisor Software v4.6 User and Troubleshooting Guide (T1789-96094, June 2010)

IMPORTANT:
• Resources are available for selection only if they are configured on an XP array.
• If you split Journal LDEVs, External RAID Group, RAID Group, XP Thin Provisioning pool, and
Snapshot into two schedules, and in Charts, you select Overall LDEVs, the combined data points
from both the schedules are plotted on the chart. In addition, repeated timestamps are displayed
if the collection frequency for both the schedules is the same. As a result, incorrect values are
plotted on the graph.
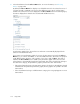
• You can select resources that belong to the same or different XP arrays, or custom groups. While
selecting the resources, press the Shift key for sequential selection, or the Ctrl key for random se-
lection of multiple resources. Accordingly, related metrics common across the selected resources
are displayed for your selection in the Choose Metrics box, for which you can plot performance
graphs in the Chart Work Area.
• You can also search for physical LDEVs in an XP array. For more information, see “Searching for
resources” on page 241.
The following steps outline the procedure for plotting a chart. Appropriate links are provided at the
end of every step that direct you to additional information related to that task:
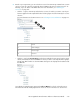
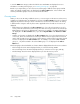
1. Click Charts in the left pane.
The Charts screen appears. By default, the Resource selection tree displays the following main
nodes:
• Individual XP arrays monitored by XP Performance Advisor, identified by their DKC or model
numbers. If user-friendly names are provided for the XP arrays, they appear in brackets beside
the DKC numbers.
• Custom Groups, lists the individual custom groups that you created.
For more information on custom groups, see “Creating custom groups” on page 84. For more
information on Charts screen layout, see “Charts screen” on page 209.
Using charts214