
HP StorageWorks XP Performance Advisor Software v4.6 User and Troubleshooting Guide (T1789-96094, June 2010)

DescriptionSections
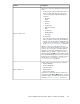
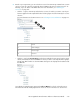
The Chart controls section displays common controls
or buttons used to perform specific tasks on charts, like
the following:
• Add a new chart window.
• Save charts as favorites and load favorite charts.
• Save charts as PDF files.
• Print charts.
• Update charts with latest data points.
• Select all the chart windows in the Chart Work
Area.
• Remove charts from the Chart Work Area.
• View performance graphs of resources for a dura-
tion of your choice.
• Forecast DKA, MP, Cache write pending, RAID
group, and ThP pool utilization.
• View the last 10 performance data points for re-
sources.
• View graphs plotted using different chart styles.
• View or hide legends, zoom preview panel, and
data points.
For more information, see “Using chart
controls” on page 244.
Chart controls
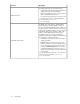
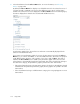
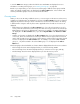
You can zoom in on performance data points for a
specified duration. You can use the Zoom preview
panel that provides a preview to the performance data
displayed in the selected chart window. You can also
zoom in on data points directly in a chart window.
For more information, see “Previewing charts” on page
254 and “Zooming in on data points across
performance graphs” on page 255.
Zoom in and zoom out on data points
Tasks you can perform on the Charts screen
• “Plotting charts” on page 213
• “Viewing charts” on page 242
• “Using chart controls” on page 244
• “Zooming in on charts” on page 254
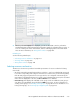
Plotting charts
Prerequisite
Ensure that the following prerequisites are met before you navigate to the Charts screen:
• Performance data collection are complete, so that the data on associated resources is displayed
under the various categories for individual XP arrays.
• Custom groups are created, so that they appear for selection under Custom Groups in the Resource
selection tree.
HP StorageWorks XP Performance Advisor Software User Guide 213