
HP StorageWorks XP Performance Advisor Software v4.6 User and Troubleshooting Guide (T1789-96094, June 2010)
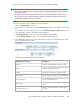

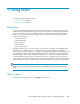
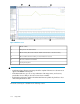

Figure 20 Charts screen
.
Charts controls1
Title pane for the chart window2
Chart window (blue border indicates that the chart window is selected or active)3
Choose Metrics box from where you select metrics for resources4
Resource selection tree for Charts5
Zoom preview panel6
IMPORTANT:
• Configuration data collection on XP arrays should be complete for the Resource selection tree to
appear under Charts in the left pane.
• In the Chart Work Area, you can use any combination of XP arrays, metrics, and resources,
provided the resources that you select do not exceed 512 in number.
• By default, the performance graphs in the Chart Work Area are plotted only for the last 1 hour
of the management station's time.
The Charts screen layout is divided into the following sections:
Using charts210