
HP StorageWorks XP Performance Advisor Software v4.6 User and Troubleshooting Guide (T1789-96094, June 2010)


11 Using charts
This chapter discusses the following topics:
• “Introduction” on page 209
• “Plotting charts” on page 213
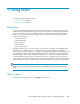
Introduction
You can plot performance graphs to view historical data of resources belonging to the same array
or different arrays. Graphical representation of resources performance is especially useful when you
want to compare similar resources of different arrays, to determine their performance and observe
trends. You can select plot performance graphs of resources for different metrics belonging to the
following metric categories:
• Frontend IO Metrics
• Frontend MB Metrics
• Utilization Metrics
• Backend Metrics
• Response Time Metrics
The metrics that you choose are resource driven, where specific set of metrics are displayed for the
selected resources. Related resources are categorized in such a way that they are available for
selection under a common category. For example, all the DKA pairs and their MPs, RAID groups and
associated physical LDEVs and pool LDEVs (LDEVs assigned for a ThP pool) are grouped under the
Back-end category. You can also analyze the performance of a resource by viewing its data points
collected at different collection rates in the same chart. You can compare the resources across XP
arrays based on and within the following metric categories. (Ensure that you select every element that
you want to appear in your chart, because the system charts only those elements that are specified):
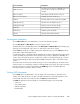
NOTE:
Firmware version later than 50.09.33 Snapshot PIDs are available for XP12000 and XP10000 type
arrays.
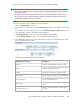
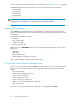
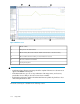
Charts screen
The Charts screen appears when you click Charts in the left pane.
HP StorageWorks XP Performance Advisor Software User Guide 209