
HP StorageWorks XP Performance Advisor Software v4.6 User and Troubleshooting Guide (T1789-96094, June 2010)
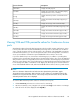
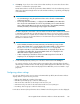
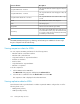

Initially, the Total IOs, Total MBs, Total Tracks, and No of Records values are displayed for an XP
array, which is the sum of all the LDEVs data. After you query the existing data, these values are
updated accordingly:
• Total IOs: Displays the total frontend IO/s handled by the selected XP array
• Total MBs: Displays the total frontend throughput in MB/s managed by the selected XP array
• Total Tracks: Displays the total tracks on the selected XP array
• No of Records: Displays the total number of LDEV records from the last collection cycle
IMPORTANT:
• If the Total I/O, Total MB/s, and Total Track fields show 0 value, it means that the external RAID
group, RAID group, XP Thin Provisioning and Snapshot pool resources are split between two
performance data schedules.
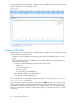
• About 150 records are displayed per page in the LDEV table. To view LDEV records on other
pages, click the corresponding page links. You can also click the prev, next, or last links to nav-
igate to the respective pages.
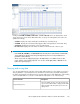
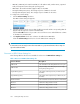
Querying and sorting data
You can query data based on the last collection date and time that you select. When you query for
data, by default, it is executed based on the last data received from the selected XP array. Further,
the data is automatically sorted based on the average read response and displayed in a descending
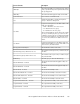
order in the LDEV table. You can also sort the LDEV records based on one of the following:
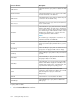
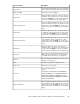
DescriptionScreen elements
This is the default selection, where the average read
response time of all the LDEVs is displayed in the LDEV
table. The LDEVs with the highest response time are
displayed first.
Avg Read Resp (msec)
HP StorageWorks XP Performance Advisor Software User Guide 193