
HP StorageWorks XP Performance Advisor Software v4.6 User and Troubleshooting Guide (T1789-96094, June 2010)
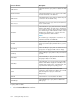
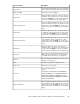
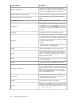
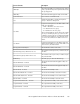

DescriptionScreen elements
Displays the SLPR group ID.SLPR Name
Displays the current status of the port (Fibre (Target),
Fibre (XP Continuous Access Initiator)).
Port Status
Displays the Ext-Lun provider’s serial number for the
array.
E-seq(s)
Displays the maximum frontend IO/s happening on
the port.
Max IO/s
Displays the average of the total frontend IO/s.Ave IO/s
Displays the minimum frontend IO/s happening on the
port.
Min IO/s
Displays the maximum frontend throughput in MB/s.Max MB/s
Displays the minimum frontend throughput in MB/s.Min MB/s
Displays the average frontend throughput in MB/s.Ave MB/s
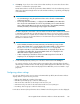
Viewing 90th and 95th percentile values for Continuous Access
ports
Write data throughputs frequently display transient peaks beyond the average performance. Sizing
to these peaks can lead to enormous bandwidth provisioning and cost. Percentiles are an effective
way to exclude the impact of these transient spikes in the calculation of the bandwidth requirements.
In XP Performance Advisor, you can view the percentile values for the average MB/s on Continuous
Access ports and further estimate the required bandwidth for the Continuous Access link.
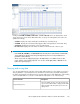
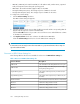
If you have identified a port as a CA Initiator and CA Target port, in addition to providing data
pertaining to the average MB/s through that port, XP Performance Advisor also reports the 90th and
95th percentile values for average MB/s based on the CA initiator and CA Target ports performance
data over a given duration. The corresponding values are displayed in the performance graphs plotted
for the average write MB/s of CA Initiator or CA Target ports. This helps you access the Continuous
Access link bandwidth and the read, and write bandwidth of the Continuous Access journal volumes.
NOTE:
There is no distinction between the read and write values plotted in the performance graphs.
The graphs show the performance data for the last one hour. If there is no performance data for the
Continuous Access port in the last one hour or the average read, and write values are zero, the 90th
and 95th percentile values are not displayed.
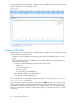
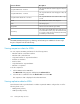
To view the 90th and 95th percentile values for Continuous Access ports:
1. Click Port Summary in the Resource selection tree for an XP array.
2. On the Port Summary screen, navigate to the port whose Port Type is CA Initiator or CA Target.
3. Click the link for the value displayed under Avg MB/s.
HP StorageWorks XP Performance Advisor Software User Guide 191