
HP StorageWorks XP Performance Advisor Software v4.6 User and Troubleshooting Guide (T1789-96094, June 2010)
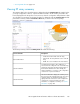

This data is also displayed when you click the Backend Total Avg group box under the Performance
View tab.
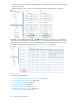
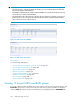
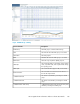
If the number of busiest LDEVs or RAID groups are less than ten or if their utilization is zero, only the
busiest resources are displayed. The 10 busiest LDEVs selected is based on the backend transfer rate
and the 10 busiest RAID groups selected is based on the Overall % RAID Group Utilization.
IMPORTANT:
• Under the LDEV tab, you can also view the associated RAID Group for an LDEV. This data helps
determine if more than one LDEV is contributing to a RAID Group activity.
• If the LDEV is a LUSE Master, the details of individual LDEVs are considered for the busiest resources
and not the sum of all the individual LDEVs.
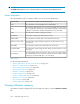
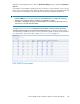
The LDEV response time resources, AVERAGE READ RESPONSE, MAXIMUM READ RESPONSE,
AVERAGE WRITE RESPONSE, and MAXIMUM WRITE RESPONSE, are measured in milliseconds.
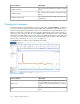
Click an LDEV ID or RAID group name to view the performance graphs for all the associated metrics
in a chart window. To know more about charts, see “Plotting charts” on page 213.
Figure 16 10 busiest backend LDEVs
.
HP StorageWorks XP Performance Advisor Software User Guide 187