
HP StorageWorks XP Performance Advisor Software v4.6 User and Troubleshooting Guide (T1789-96094, June 2010)
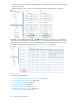
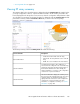
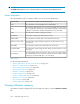
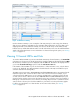
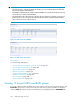
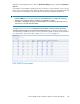
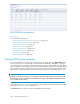
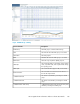
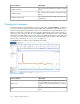

Figure 13 Utilization Summary
.
Use the utilization summary to view a snapshot of XP array activity for cache usage, bus utilization,
ACP processor utilization, and CHIP processor utilization that includes Micro Processor (MP) to port
mapping information. The utilization summary view also lists the XP array's serial number, model,
firmware version, and the date and time when occurred. Click the blue text to view the related utilization
graph in the Chart Work Area. For more information on charts and using chart options, see “Plotting
charts” on page 213.
Viewing 10 busiest LDEVs and Ports
To view the 10 busiest LDEVs or ports associated with an XP array's frontend activities, click FrontEndIO
in the Resource selection tree for the XP array. The top 10 busiest LDEVs are displayed under the LDEV
tab and the top 10 busiest ports are displayed under the Ports tab. This data is also displayed when
you click the Frontend Total Avg group box under the Performance View tab.
If the number of busiest LDEVs or ports are less than ten or if their utilization is zero, only the busiest
resources are displayed. The 10 busiest LDEVs selected is based on the IO/s and 10 busiest ports
selected is based on the average IO/s.
The LDEV response time metrics, MAX READ RESP and MAX WRITE RESP (msec) are measured as the
maximum response time over the last 30 secondss of the collection interval. For example, if your
collection interval for RAID group is set to 5 minutes, the MAX value is calculated over the last 30
seconds of the 5 minute collection interval. The AVG READ RESP and AVG WRITE RESP (msec) are
measured as the average response time calculated over the entire collection period. For example, if
RAID group collection interval is set to 5 minutes, the Average Response Time is calculated over the
entire 5 minutes collection period. Click an LDEV ID or port name to view the performance graphs
for all the associated metrics in a chart window. To know more about charts, see “Plotting
charts” on page 213.
HP StorageWorks XP Performance Advisor Software User Guide 185