
HP StorageWorks XP Performance Advisor Software v4.6 User and Troubleshooting Guide (T1789-96094, June 2010)


Viewing performance summary
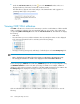
The performance summary for an XP array appears under the Performance View tab. The data
displayed is from the last collection and comprises of the following(see Figure 12 on page 174):
DescriptionScreen elements
• DKC Time: Displays the timestamp of when the
latest performance data collection complete for
DKC.
• Raid Group Time: Displays the timestamp of when
the latest performance data collection completes
for RAID groups.
• Port Time: Displays the timestamp of when the latest
performance data collection completes for ports.
Click the General link to view the “Utilization
Summary” on page 185 report for the selected XP array.
For more information, see “Utilization
Summary” on page 184.
General group box
Displays all port activity that takes place on the
frontend. The array frontend is the sum of all CHIP port
activities. Click the Frontend Total Avg group box to
view the details of the “10 busiest
LDEVs/Ports” on page 185.
Frontend Total Avg group box
Measures the backend transfers. The array backend
is the sum of all ACP pair activities. Click the Array
Backend Total group box to view the details of the “10
busiest LDEVs/RAID groups” on page 186.
Backend Total Avg group box
Displays the cache usage writes pending, and sidefile
usage data for the selected XP array. Click the Cache
group box or the cache usage writes pending, and
sidefile usage blocks to view the respective usage
graphs in the Chart Work Area. For more information,
see “Cache usage chart” on page 178.
Cache [Total - ### MB] group box
Displays the utilization percentage of the CHIP and
ACP pair for the Cache Memory Bus and Shared
Memory Bus.
Bus/Path Util % group box
Displays the IO/s, MB/s, and associated port numbers
for only those CHIPs that are active for the selected XP
array. Click CHIP for an XP array to view the
multiprocessor (MP) utilization and port activity of all
the installed CHIPs. Clicking an individual CHIP
displays its summary, MP utilization, port activity, port
IO/s and MB/s details. For more information, see
“Viewing CHIP/CHA utilization” on page 180.
CHIP Port Activity Ave group box
Displays the CLPR utilization percentage. Also, provides
an advisory based on the CLPR utilization for the past
one week. For more information, see “Advisory on
CLPR utilization” on page 179.
CLPR Details group box
Viewing XP arrays resources176